


Dear brave reader,
Financial history can chart the lives of businesses. Want to know how the world’s largest technology companies weather their geopolitical lives? Sail around and explore the stories their dollars and numbers tell us about today.
Welcome to the heart of “Bay Area Abroad: Innovation through Fragmentation”, two special chapters, posted together that explore how various commercial metrics can help understand whether Bay Area technology flows are fragmenting along geopolitical lines.
The first chapter assesses if the Bay Area Engine—of talent, investment, and commercialization—is being disrupted by geopolitics. The second chapter observes exposure: how much of Bay Area technology business rides on markets around the world?
Table of Contents: Introduction | How the Bay Area Makes New Tech | The Cold War | Japan | Globalization of the 1990s | China into Today | Today’s Fragmenting Flashpoints | Assessing The Engine & The Exposure | Conclusion
Since I explore funky ways to figure out if geopolitics impacts tech business.... it might get a little weird... please, pray, tell me if you think about things differently. We’re on schedule for publishing with BACEI.
I always push for purity. This is my writing. It would be disrespectful to have you read something that wasn’t. I’ve left an AI disclaimer at the end.
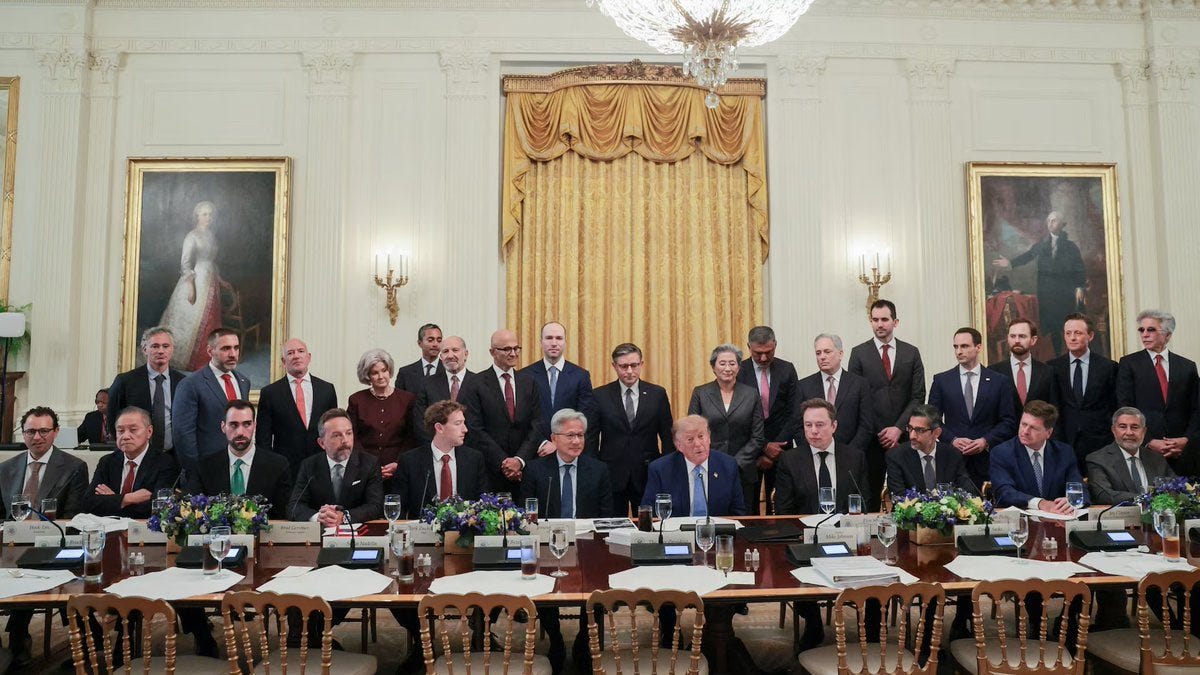
The Firms to Survey for Fragmentation
Are Bay Area technology flows fragmenting along geopolitical blocs today? Answering this requires a reproducible dataset of Bay Area technology firms with a worldwide presence. This section outlines how those companies were selected. Beginning with more than 2,000 public and private companies—drawn from the 2025 edition of the Forbes Global 2000 for public firms, and from announced valuations and raised capital for private ones—the list passes through three cuts: headquarters, sector, and scale. This distills the pool to 47 Bay Area-based technology companies, which the rest of this report surveys.
List of Analyzed Bay Area Technology Companies
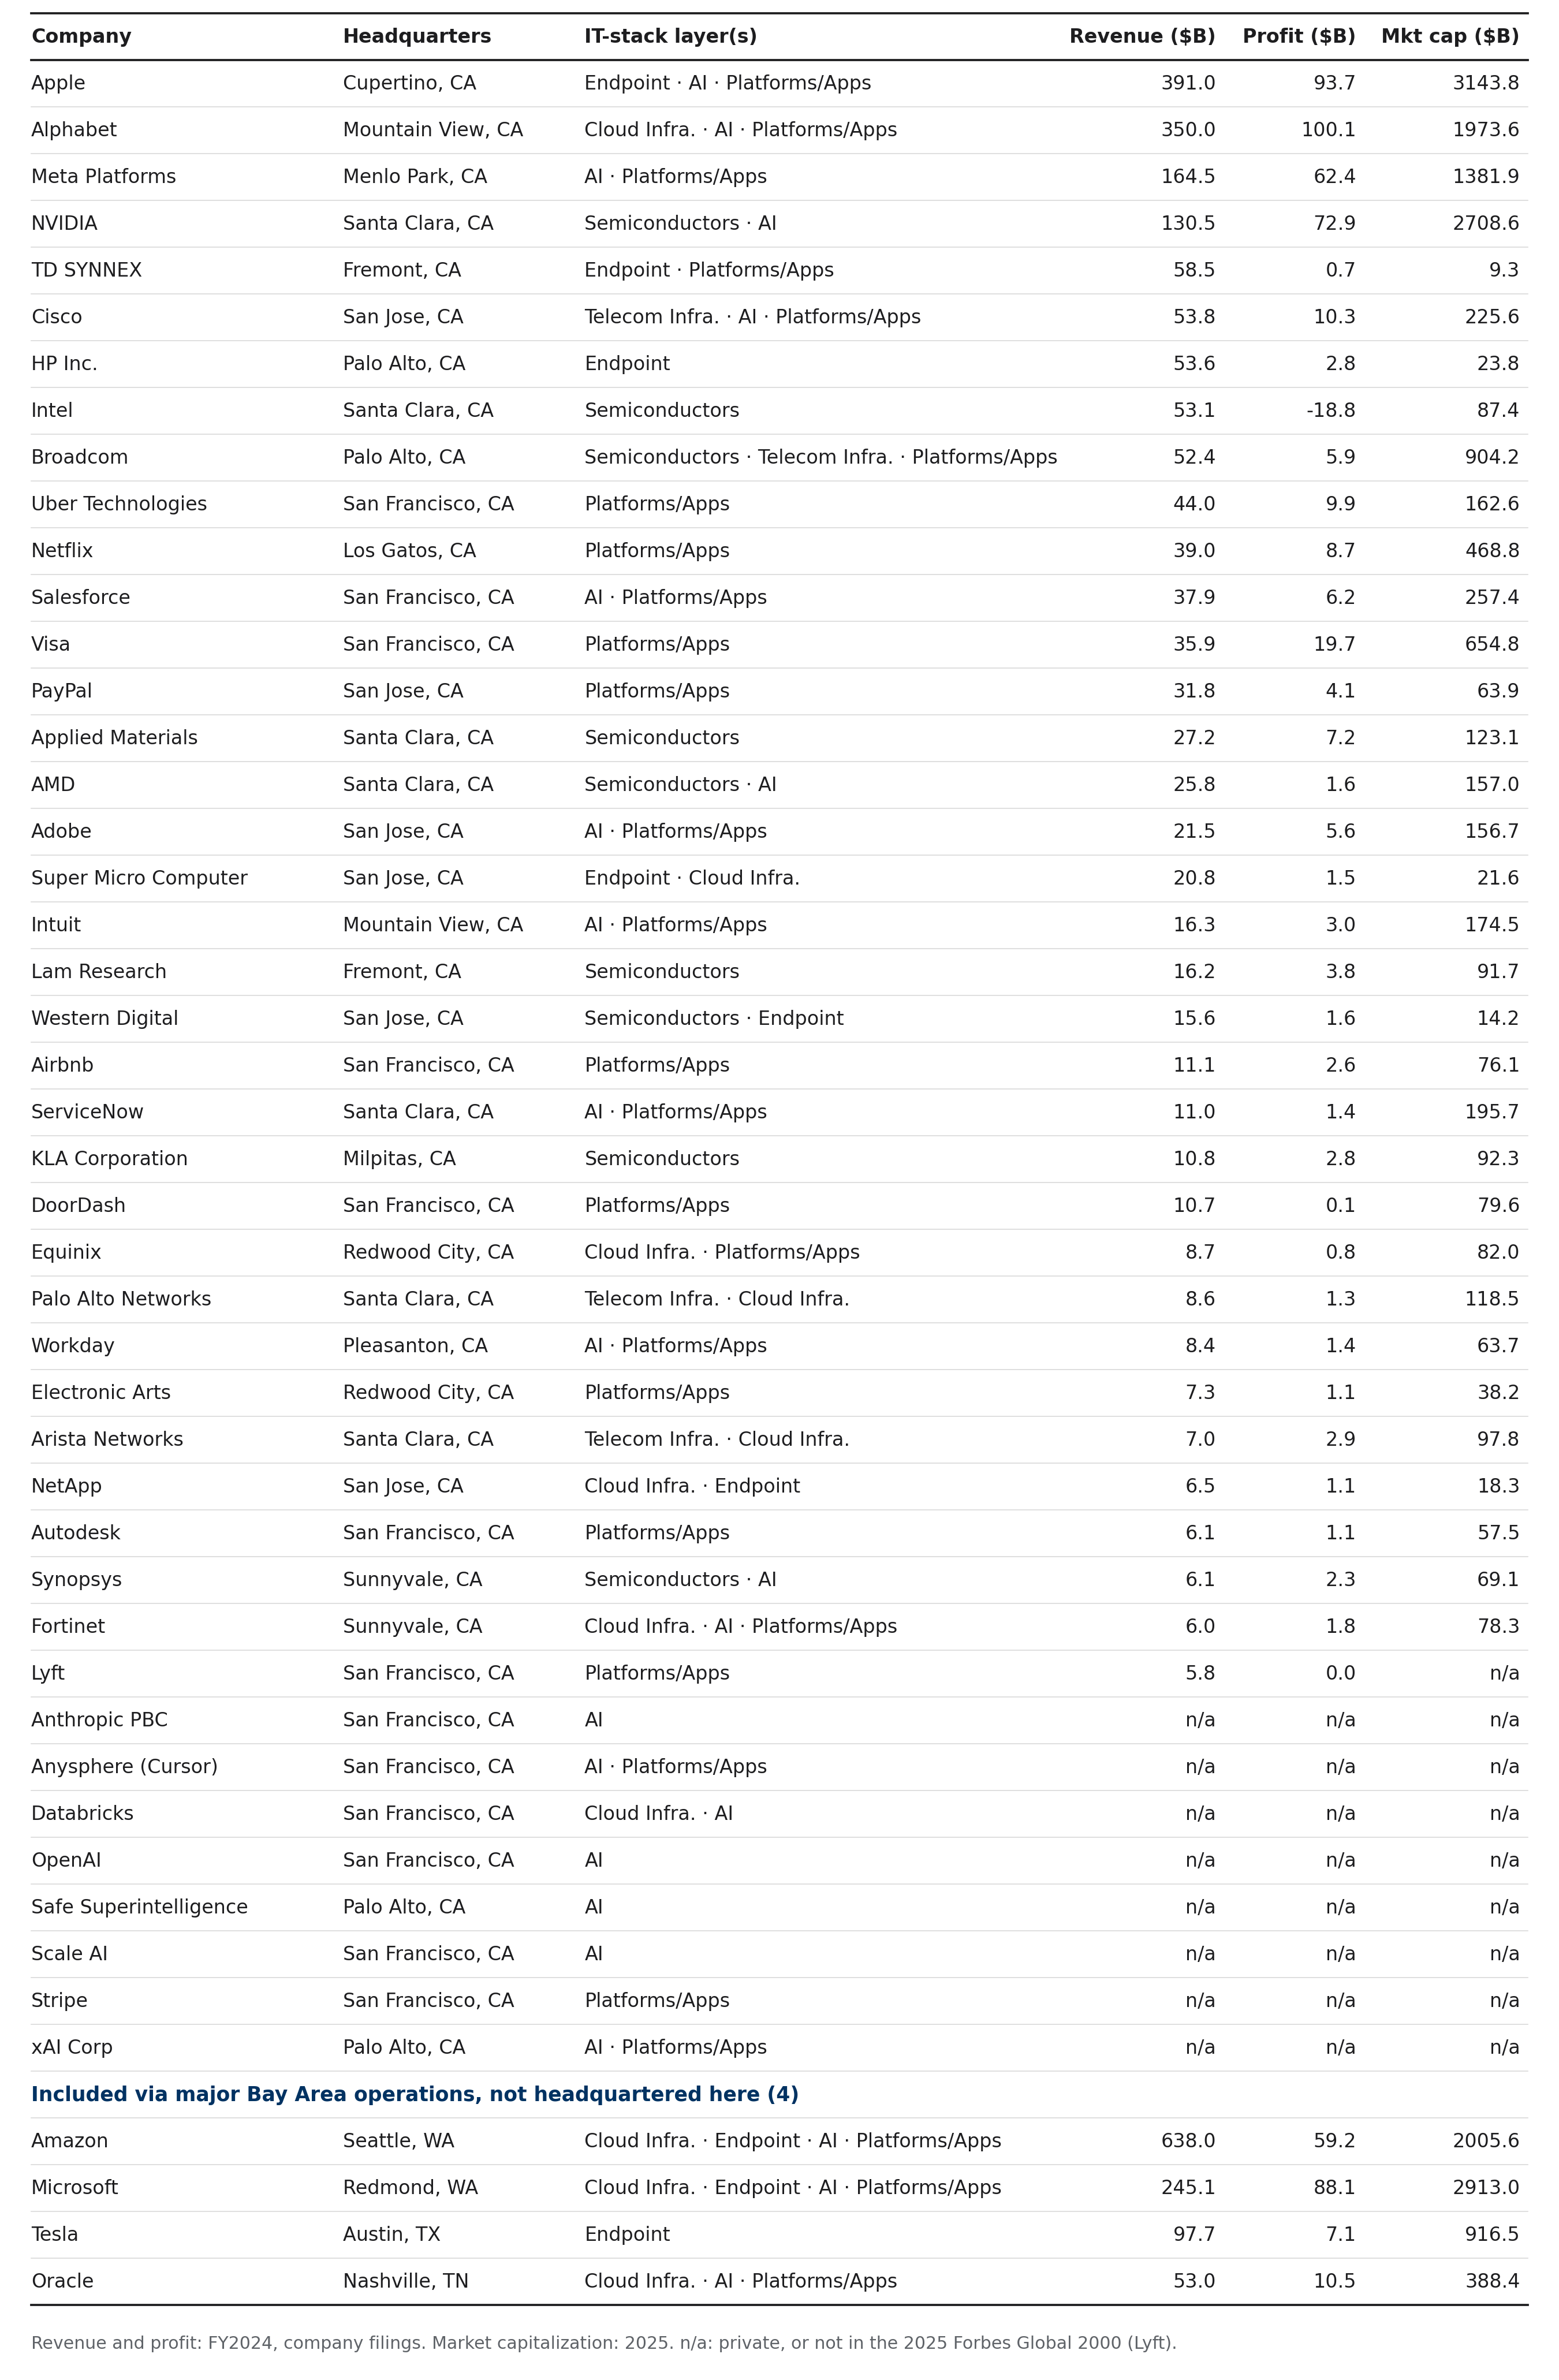
Lyft is not in the 2025 edition of the Forbes Global 2000 that standardizes FY2024s. It last appeared in the 2019 edition and is retained on the roster after meeting the borderline floor for scale.
The remainder of this section briefly outlines each of the three selection cuts before turning to the metrics analyzed.
How to define a “Bay Area” Company
Whether a company qualifies as a “Bay Area” company is first based on its legal incorporation. Of the nine Bay Area counties, four are represented across 43 of the 47 companies studied: 24 are based in Santa Clara, 13 in San Francisco, three in Alameda, three in San Mateo. On a second pass, four additional technology companies were included because of their historical grounding in the region. A firm qualifies if it maintains at least 5,000 employees in the nine-county region or operates a central R&D facility there. By this standard, Amazon, Microsoft, Tesla, and Oracle are included despite being headquartered elsewhere.
How to define a Technology Company
Varying definitions of technology companies exist; this report anchors its definition in how companies navigate the changing world order. To qualify, a firm must derive its core commercial activity from at least one of six layers of the information-technology stack (“IT Stack”) as defined by Baums & Butts in Tech Cold War: 1) semiconductors, 2) telecom infrastructure, 3) cloud infrastructure, 4) endpoint devices, 5) artificial intelligence, and 6) digital platforms and applications.
A company that relies on the IT Stack as a tool, but without deriving its core commercial activity from it, does not qualify. This excludes Wells Fargo, a bank headquartered in the Bay Area whose core business is financial services rather than technology, while still including Visa, whose core business is a digital payments platform (6). Companies that innovate technology for a specific vertical sector are likewise excluded, such as major Bay Area biotechnology companies like Genentech, Gilead, and AbbVie. Though significant drivers of regional innovation and employment, these firms are excluded because their advances do not diffuse across other sectors, and including them would invite scope creep toward any other company that uses information technology to innovate within a vertical sector, such as “agritech”, “biotech”, “edtech”, and more.
How to define size
The third cut sets a floor on company size. Not every Bay Area company within the IT stack possesses the scale where its presence in the world economy makes for geopolitical relevance. Startups are numerous but often small, and data availability is limited; this cut therefore filters firms through the 2025 edition of the Forbes Global 2000 (FY2024 financials), which ranks public companies on a blend of four measures: revenue, profit, assets, and market value. Private firms are held to a parallel standard, since they do not report revenue the way public firms do: they must either exceed a $10 billion valuation or have raised more than $2 billion in capital.
With this dataset established, the following chapter reassess the engine today by asking: does the Bay Area’s cluster of technology firms still show the same capacity for reinvention that carried it through the Cold War, Japan, and China’s rise, or is fragmentation now visibly underway?
Chapter 8: Assessing the Engine
To understand how geopolitics are affecting the Bay Area technology companies, this section tests the strength of its engine globally today. This section measures the global share of talent, investment, and ability for these firms to commercialize their technology, i.e. turn a profit.
Little Sign of Talent Fragmenting
At the foundation of the Bay Area innovation engine is its high-skilled talent base. If geopolitics are fragmenting the engine’s talent, then the flow of immigration would be disrupted. This section observes whether that’s true based on census and H-1B data.
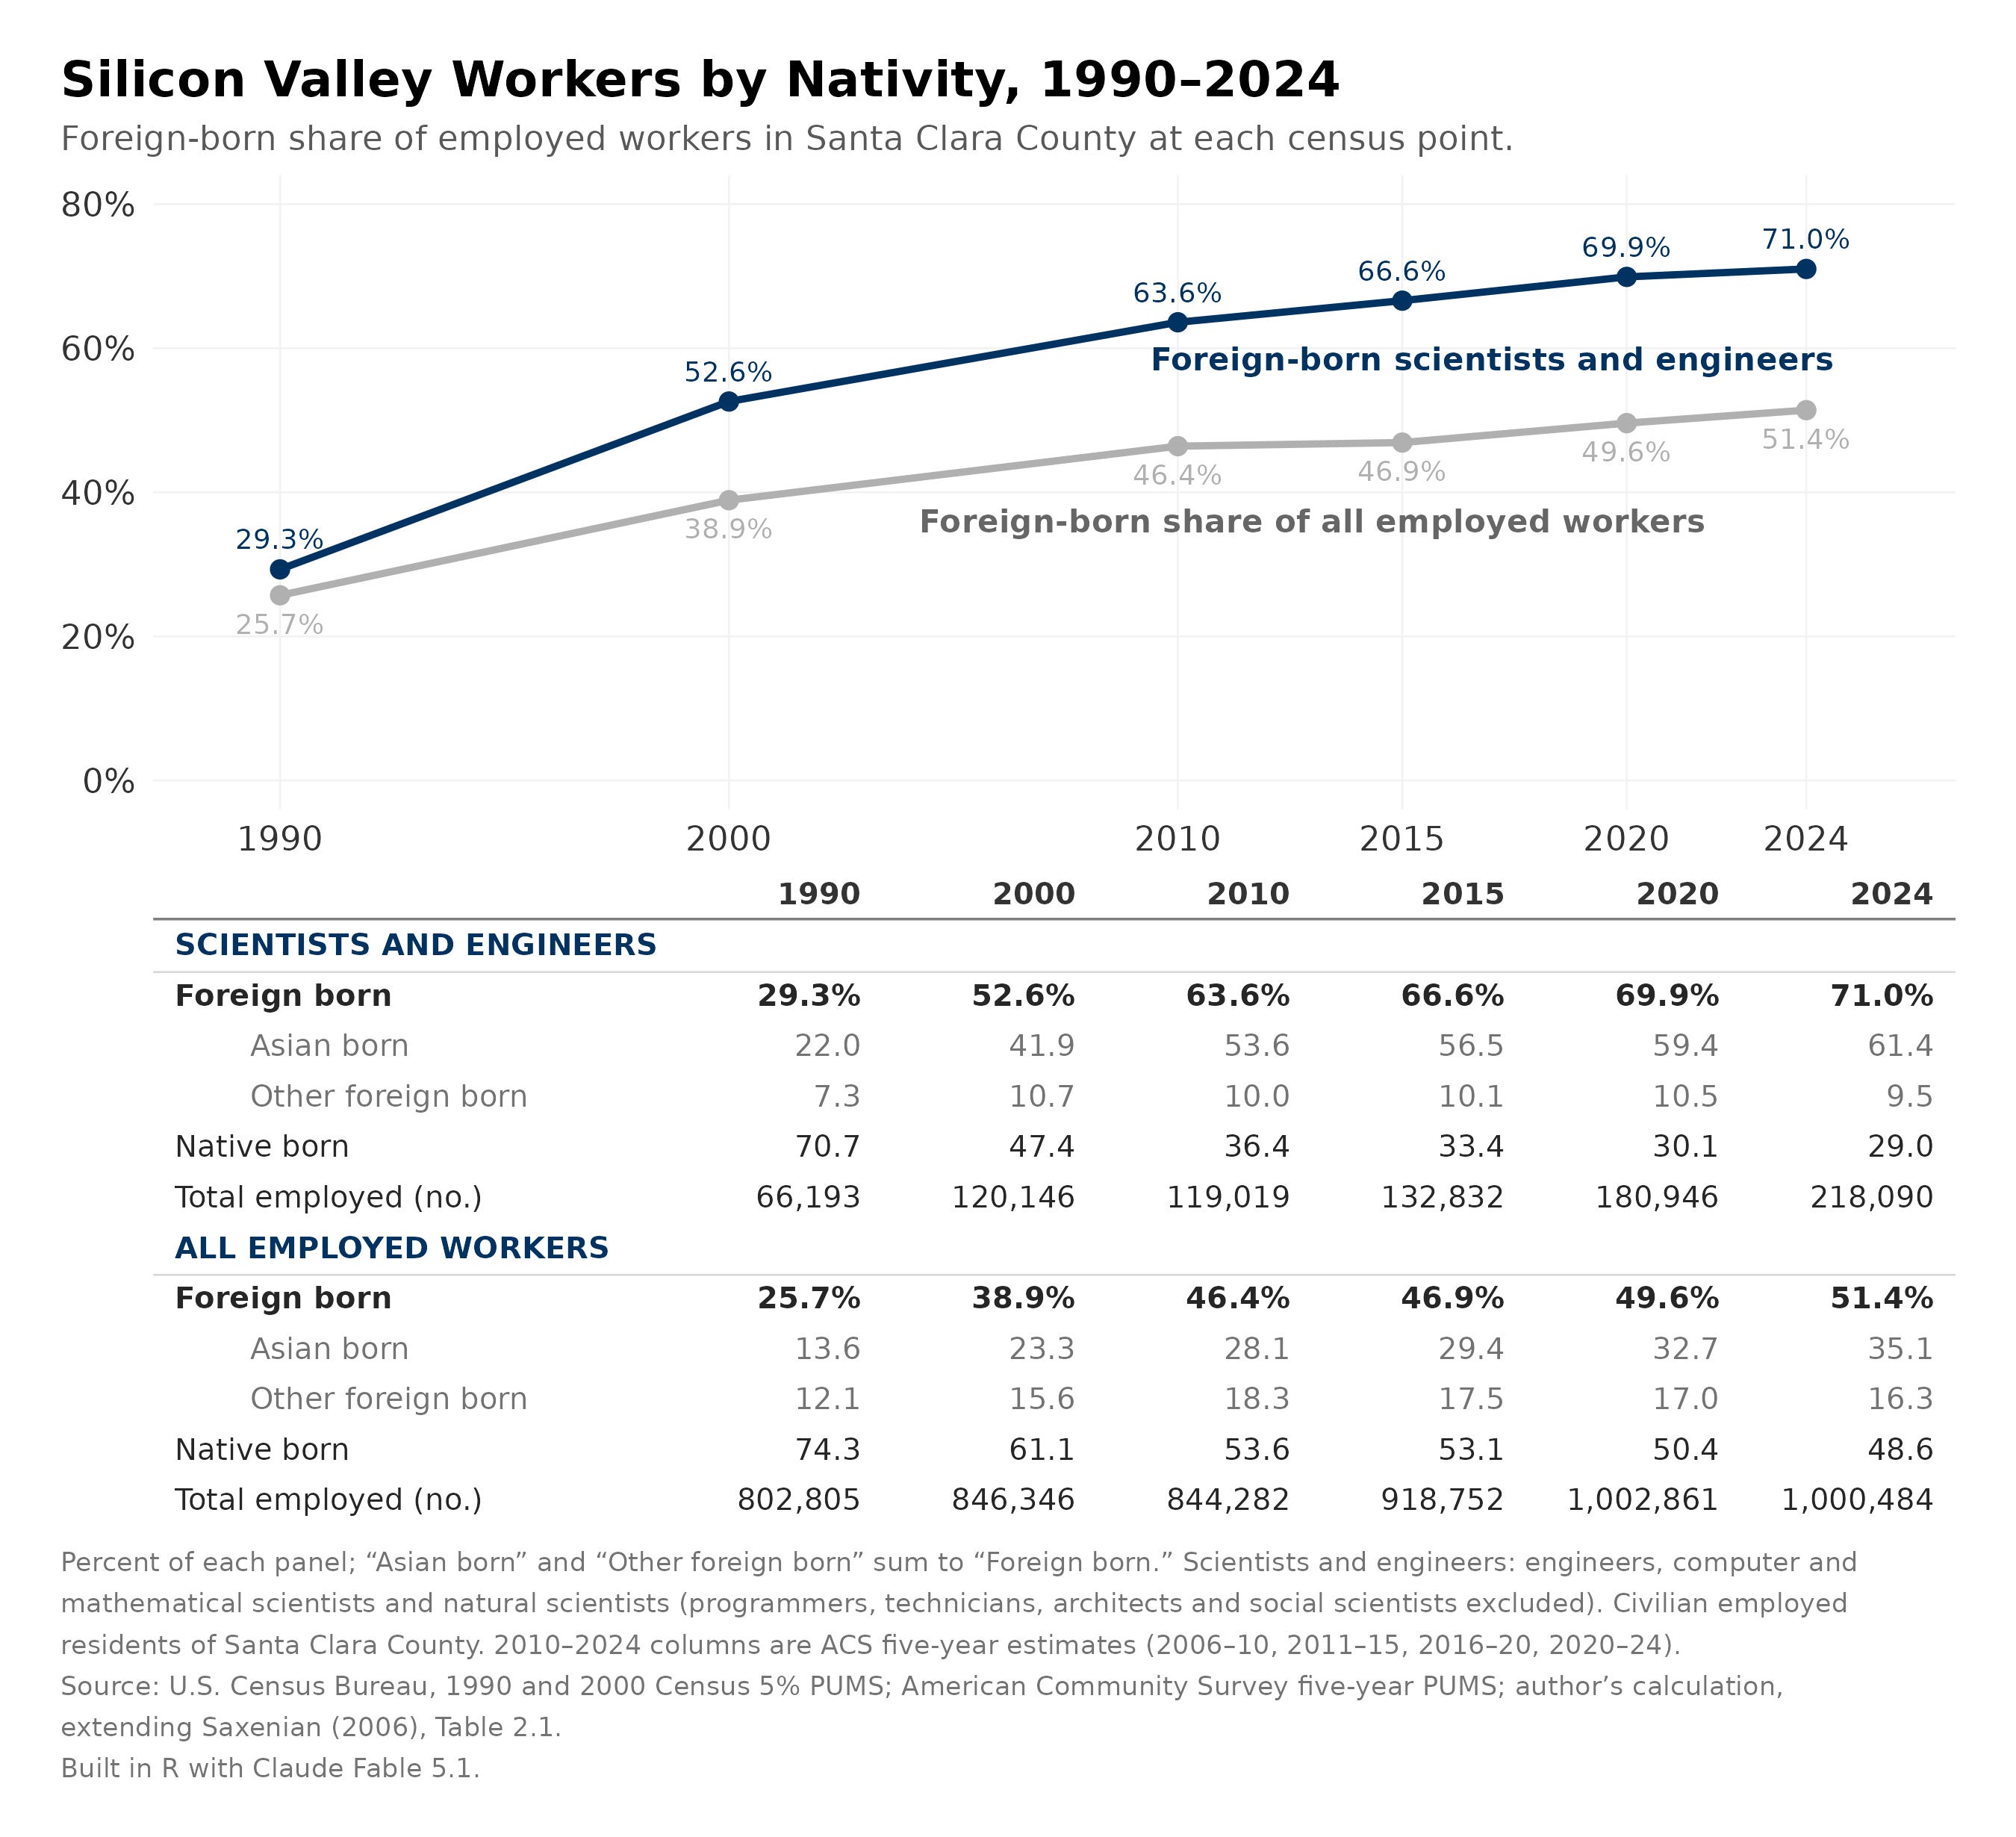
High-skilled immigrant talent has continued to grow in the Bay Area. From 2000 to 2024, the share of foreign-born scientists and engineers employed in Santa Clara County rose from 52.6% to 71.0%, while the share of native born fell from 47.4% to 29.0%. The share of Asian born scientists and engineers, and all employed workers for that matter, has steadily climbed for over two decades since 2000. But since 2010, it has slowed by about half among scientists and engineers, from 1.2 to 0.6 percentage points a year. The 2025 Silicon Valley Index corroborates this independent census analysis, finding that “Forty-one percent of Silicon Valley’s population is foreign-born (a historic high); among employed residents, 48 percent are foreign-born. This figure jumps to 66 percent in tech, where 70 percent of tech workers are Indian or Chinese and 73 percent of female tech workers are foreign-born.”1
Observing the list of Bay Area technology companies, 47% (22 of the 47) companies have at least one immigrant founder. Many have lived in America their entire life, having benefitted from open immigration policies. The list of Bay Area founders’ nationality tracks census data: Asia comprises the largest group—Jensen Huang of Taiwan at NVIDIA, Ken Xie of China at Fortinet, David Lam of China at Lam Research, Charles Liang of Taiwan at Super Micro Computer and Tony Xu of China at DoorDash. Europe follows, with Sergey Brin of Russia at Alphabet, Aart de Geus of the Netherlands at Synopsys and the Collison brothers of Ireland at Stripe. The Middle East, Latin America and Africa supply the rest: Nir Zuk of Israel at Palo Alto Networks, Eduardo Saverin of Brazil at Meta and Elon Musk of South Africa at Tesla, xAI, and OpenAI.
But recent worries of an eroding domestic engineering base have sparked Washington to restrict the flow of high-skilled immigration for several reasons, including national competitiveness. In 2025, the Trump administration sought to restrict the approval of H-1B visas—typically the practical way for a high-skilled foreign national to work long-term in the United States. The proclamation required new H-1B workers’ entry to be accompanied by a $100,000 payment, but a federal court vacated it in June 2026, and an appeals court refused to reinstate it in July.2
Have H-1B approvals fallen as a result of these policies? Marginally. According to the National Foundation for American Policy, “the denial rate for H-1B petitions for initial employment rose to 2.8% in FY 2025 from 2.5% in FY 2024.”3 In FY 2025, the top spots for approvals of new H-1B petitions were all held by Bay Area technology companies on the list: Amazon (4,644), Meta Platforms (1,555), Microsoft (1,394) and Google (1,050). California employers approved the most overall (21,559).4
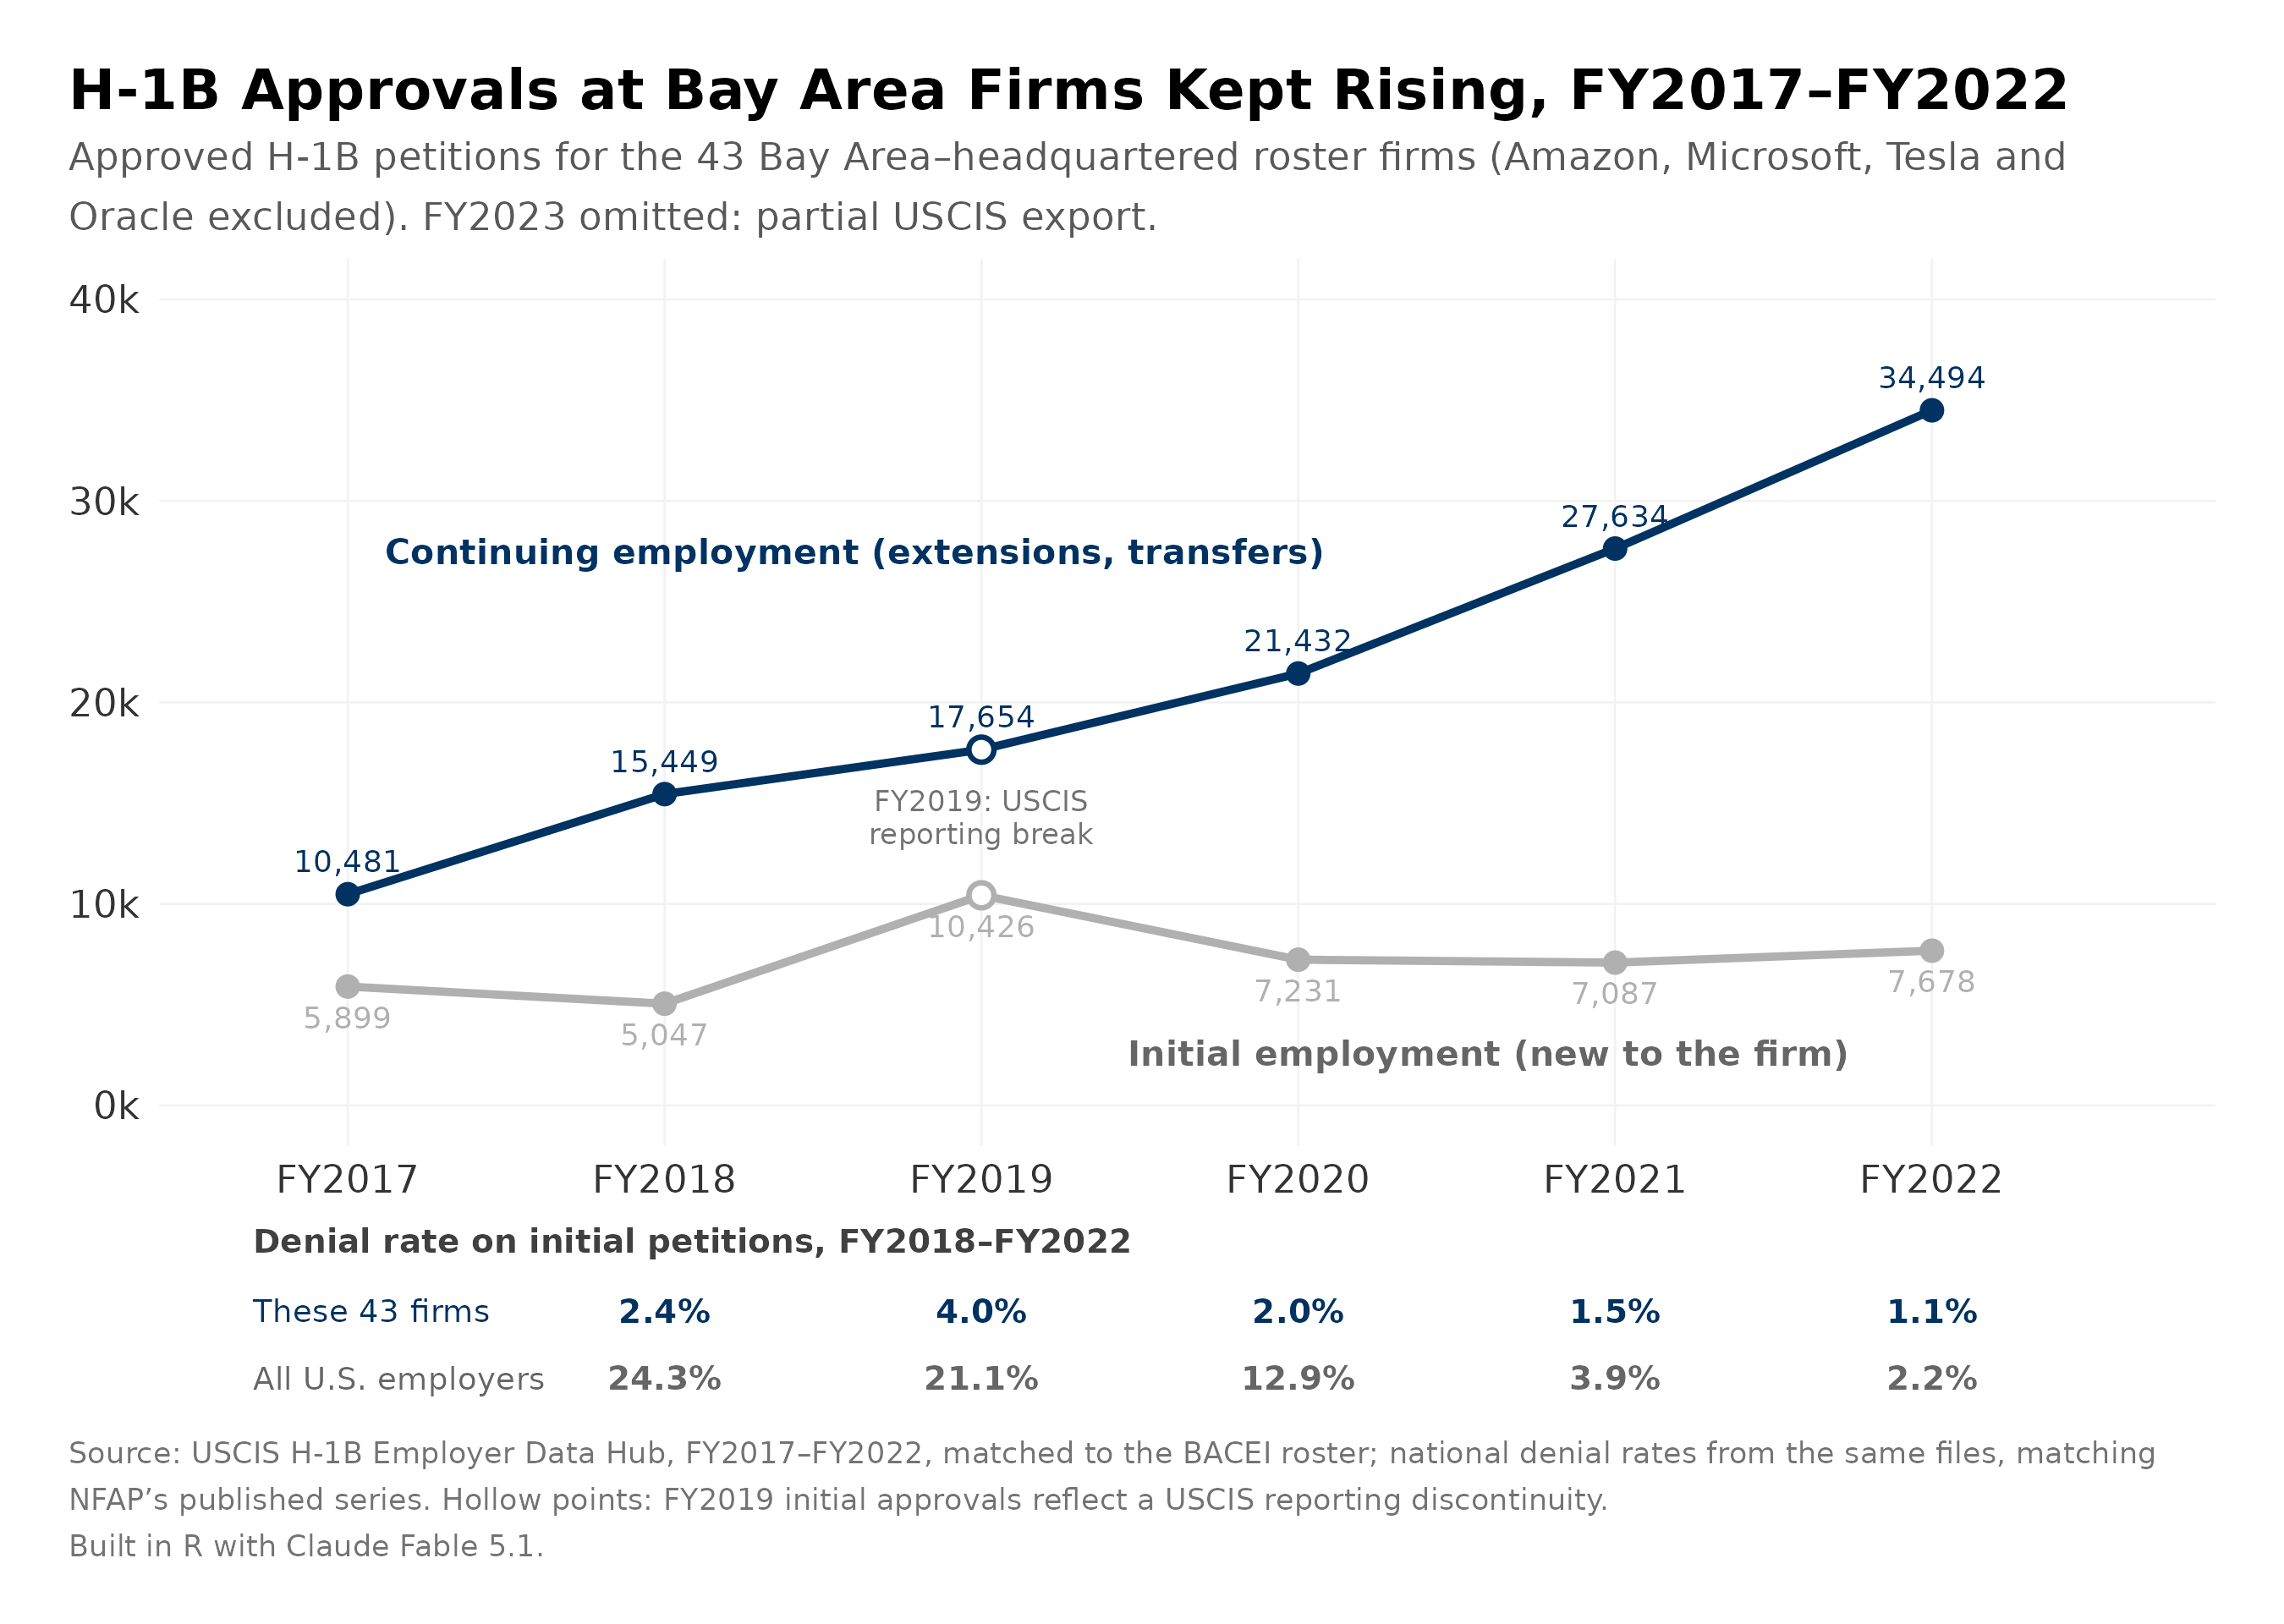
Though H-1B rates have barely moved, the number of international students arriving to the United States has plummeted. The Department of State reported that 23% fewer student visas were issued in 2025 compared to the previous year.5 The two largest countries that send the most students, India and China, fell 60.5% and 30.3% respectively.6 For China, the White House and Department of State justify restrictions out of concerns that Chinese students and researchers act as “non-traditional collectors” to acquire sensitive technologies and intellectual properties.7 No direct proclamation that suggests India poses a security concern exists. The biggest dip was Iran; compared to 2024, over 90% fewer student visas were issued to Iranian nationals.
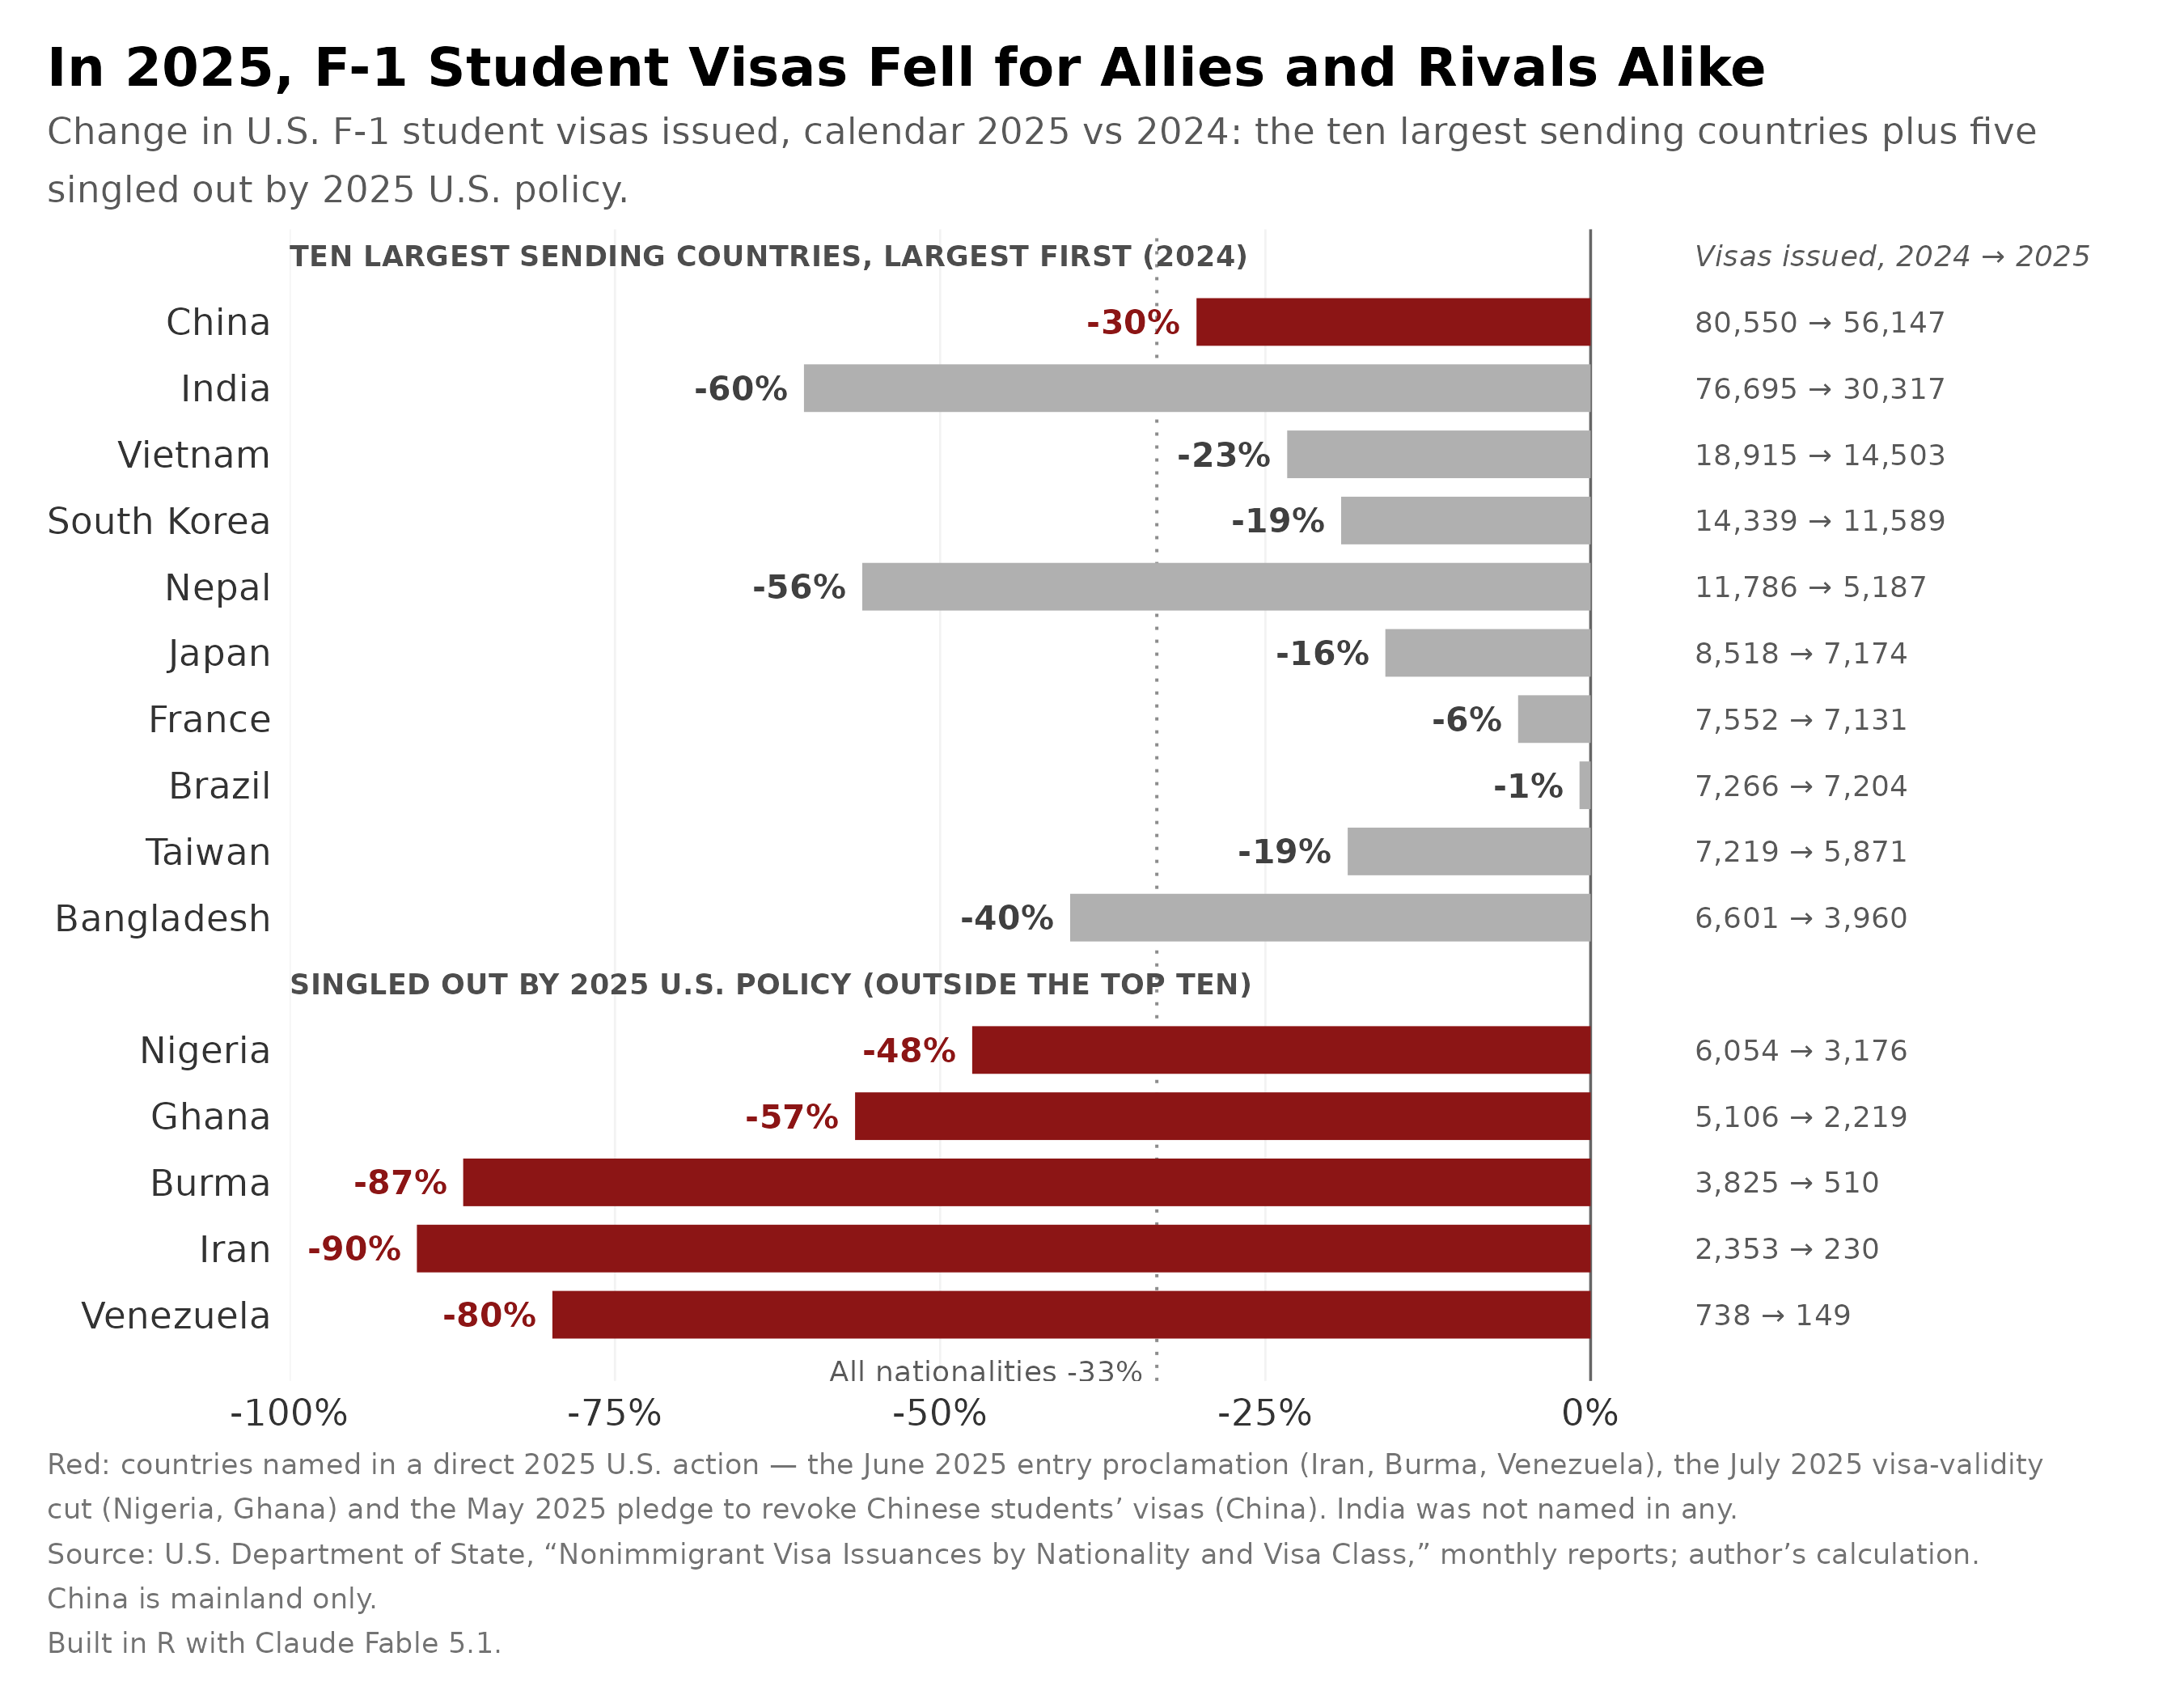
H-1B lottery swings are important to note but require more time to understand whether Washington’s policies are fragmenting the Bay Area’s access to top-tier foreign talent, a critical part of the engine for decades. Policymakers appear to be pursuing a dual mandate: combatting fraud, including multi-registrants, and also counteracting demand for foreign talent to restore a homegrown base that competes. That second reason, Washington asserts, is to address how companies have “deliberately exploited” the program “to replace, rather than supplement, American workers with lower-paid, lower-skilled labor.”8 Though student and lottery entrants may be shrinking, both are US policy choices currently applied to everyone, not exclusively applied along geopolitical blocs. Over the next decade, these policy tools could turn into levers to further enhance economic security.
These immigration metrics suggest the Bay Area’s foreign talent base remains intact, but policies are arising that threaten to fragment flows. At every census point between 2000 and 2024, the foreign-born share of scientists and engineers in Santa Clara County rose, from 52.6% to 71.0%. At the top, the roster’s leadership is international; 22 of the 47 companies carry a founder born in Asia, Europe, the Middle East, Latin America, or Africa. But the bar to arrive is rising: student visas fell 23% in 2025. Registrations for the H-1B lottery fell by more than half in two years, from 470,342 to 211,600. Since 2026, the lottery gives higher-wage job offers a better chance for visas.9 These metrics suggest the requirements to study and work in the Bay Area are rising.
Investment Continues to Concentrate
The Bay Area remains a strong source in attracting high-technology investment to its companies. Market capitalization tracks where investors park their money in public markets, and reflects investor confidence in a company’s future growth prospects.10 If investment were to be affected by fragmentation, we would expect to see various indicators of investor confidence fall, including market capitalization. The strong share of global technology investment directed toward the Bay Area suggests investors remain confident in the cluster’s perceived technological advantage, entrepreneurial culture, and future returns.
Observing changes in market capitalization reveals how investors feel about the future macroeconomic environment. Investors in companies more exposed to geopolitics will naturally weight flashpoints as higher risk factors. These companies operate in the best capital market in the world. As Vagle and Brooks note, relative to other financial hubs like China, where capital controls depress reported figures, “the openness of US capital markets”11 makes the US market itself a safe haven for investment, regardless of the company’s positioning. It’s easier to invest in the United States—which means the stock itself is the product, rather than the technology. Financialization and easing the flow of investment helps prevent fragmentation, rather than the fundamental trade of technology. As Sean Kenji Starrs said in an interview,12 “market value is probably a more important metric for investors, but investors are looking at the future.” This is one metric to complement others; the price sometimes reflecting broader investor mood as much as the company’s underlying performance.
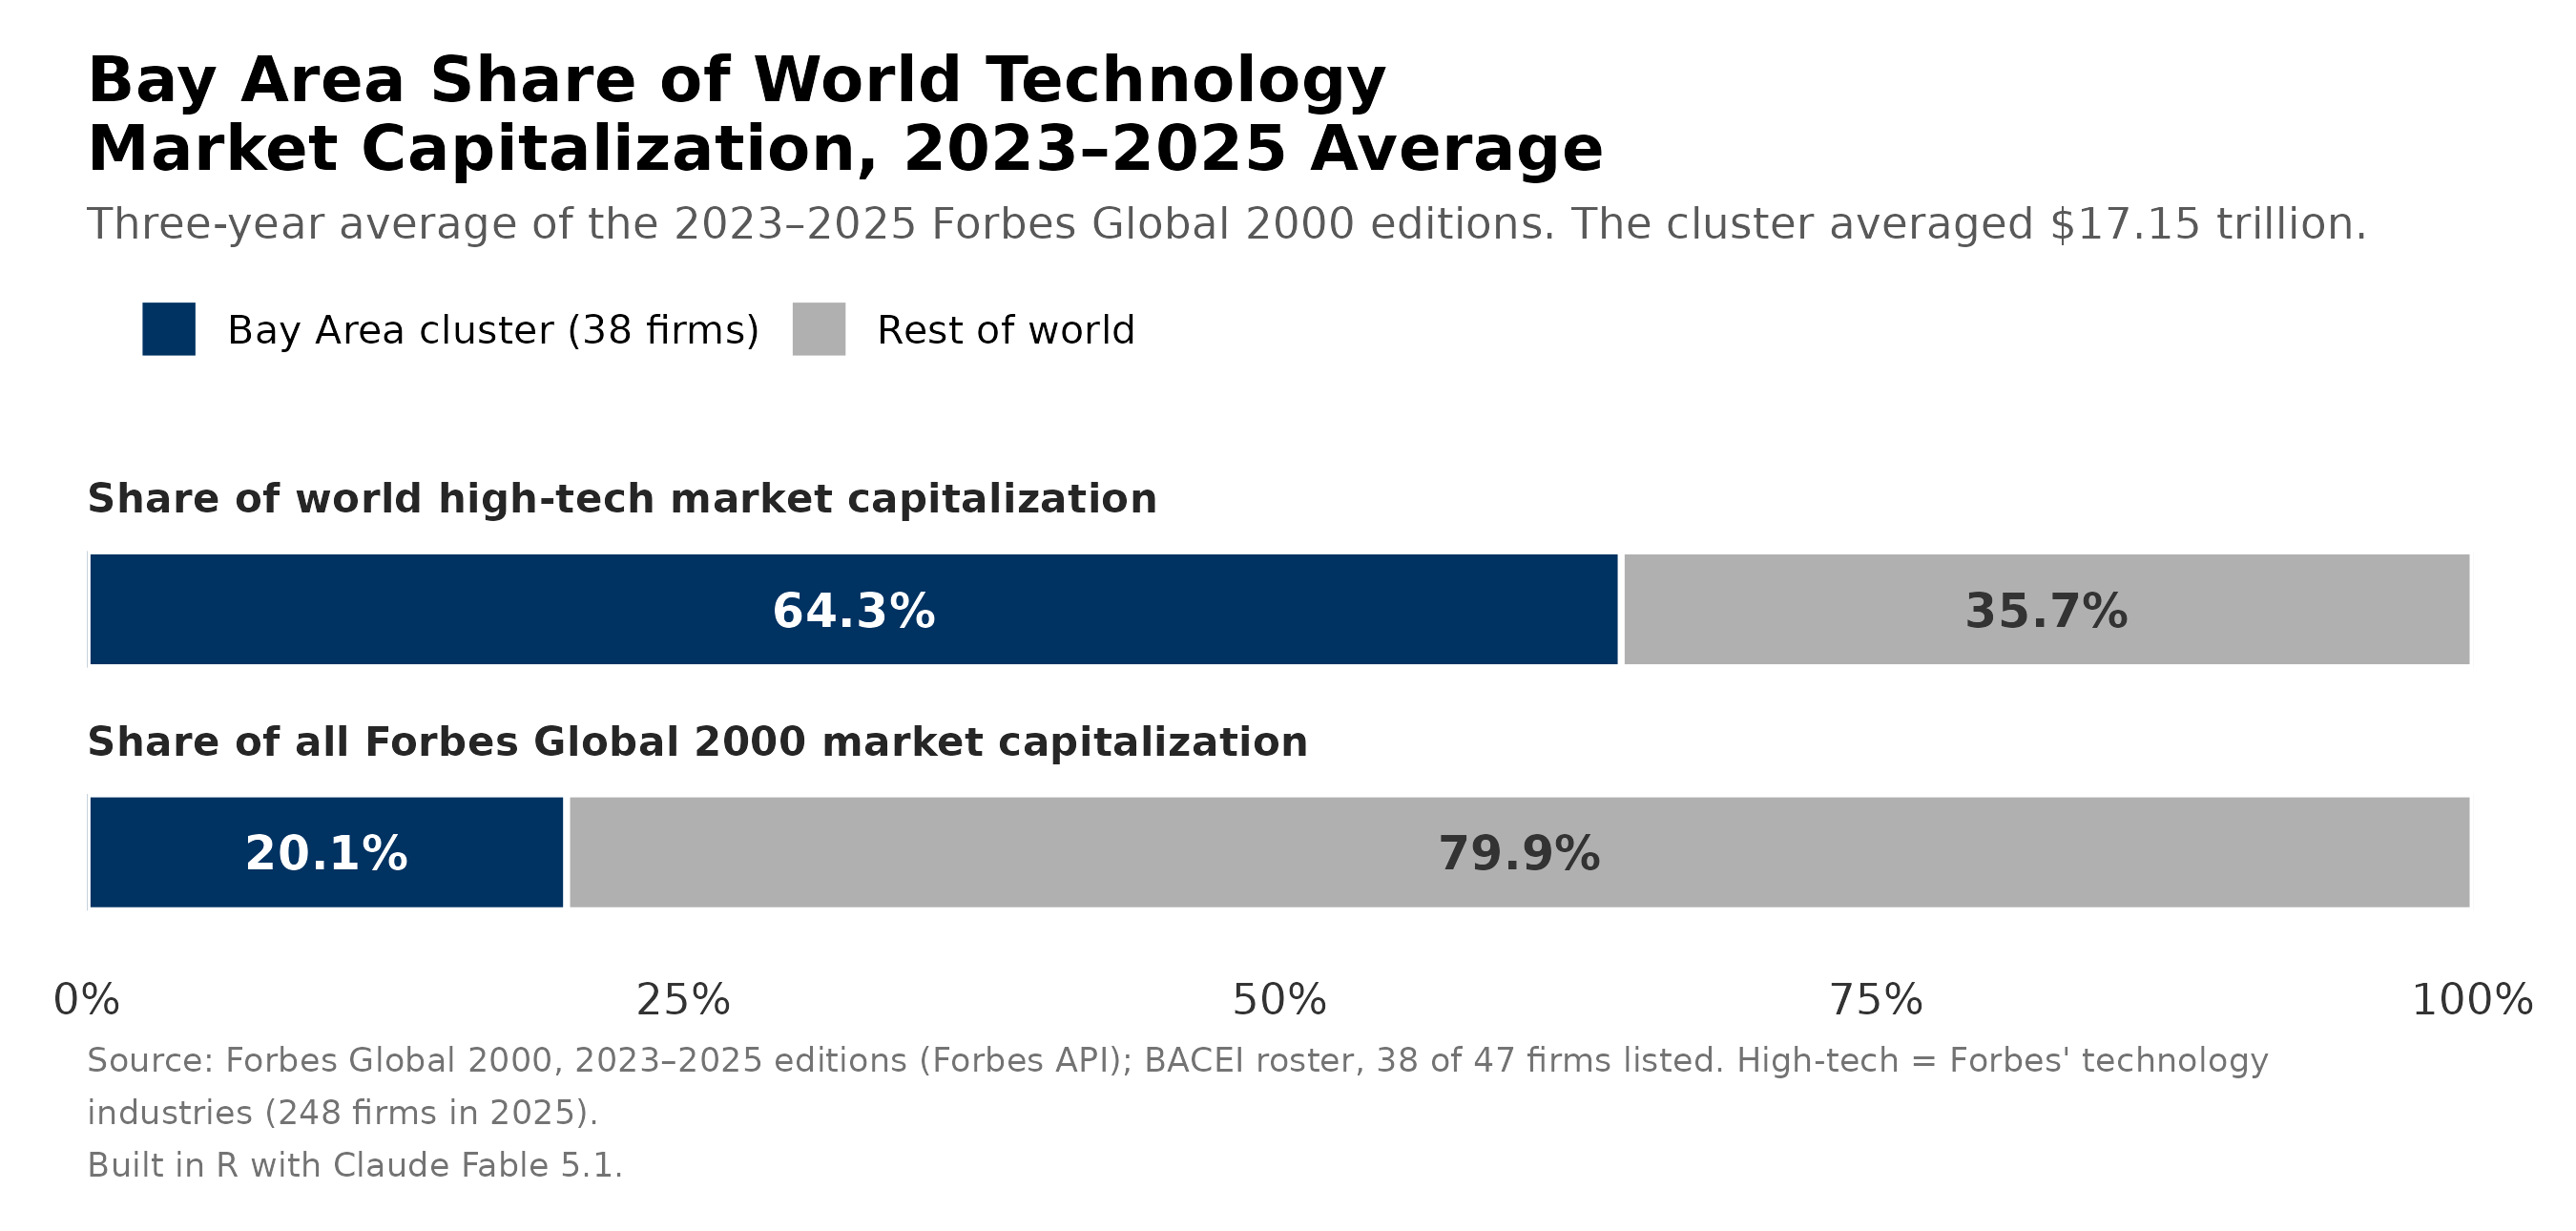
On a three-year average across 2023-2025, this Bay Area cluster commands $17.15 trillion in market capitalization—64% of the entire world’s high-tech sector’s market capitalization, and about 20% of the market value of all Forbes Global 2000 companies worldwide.
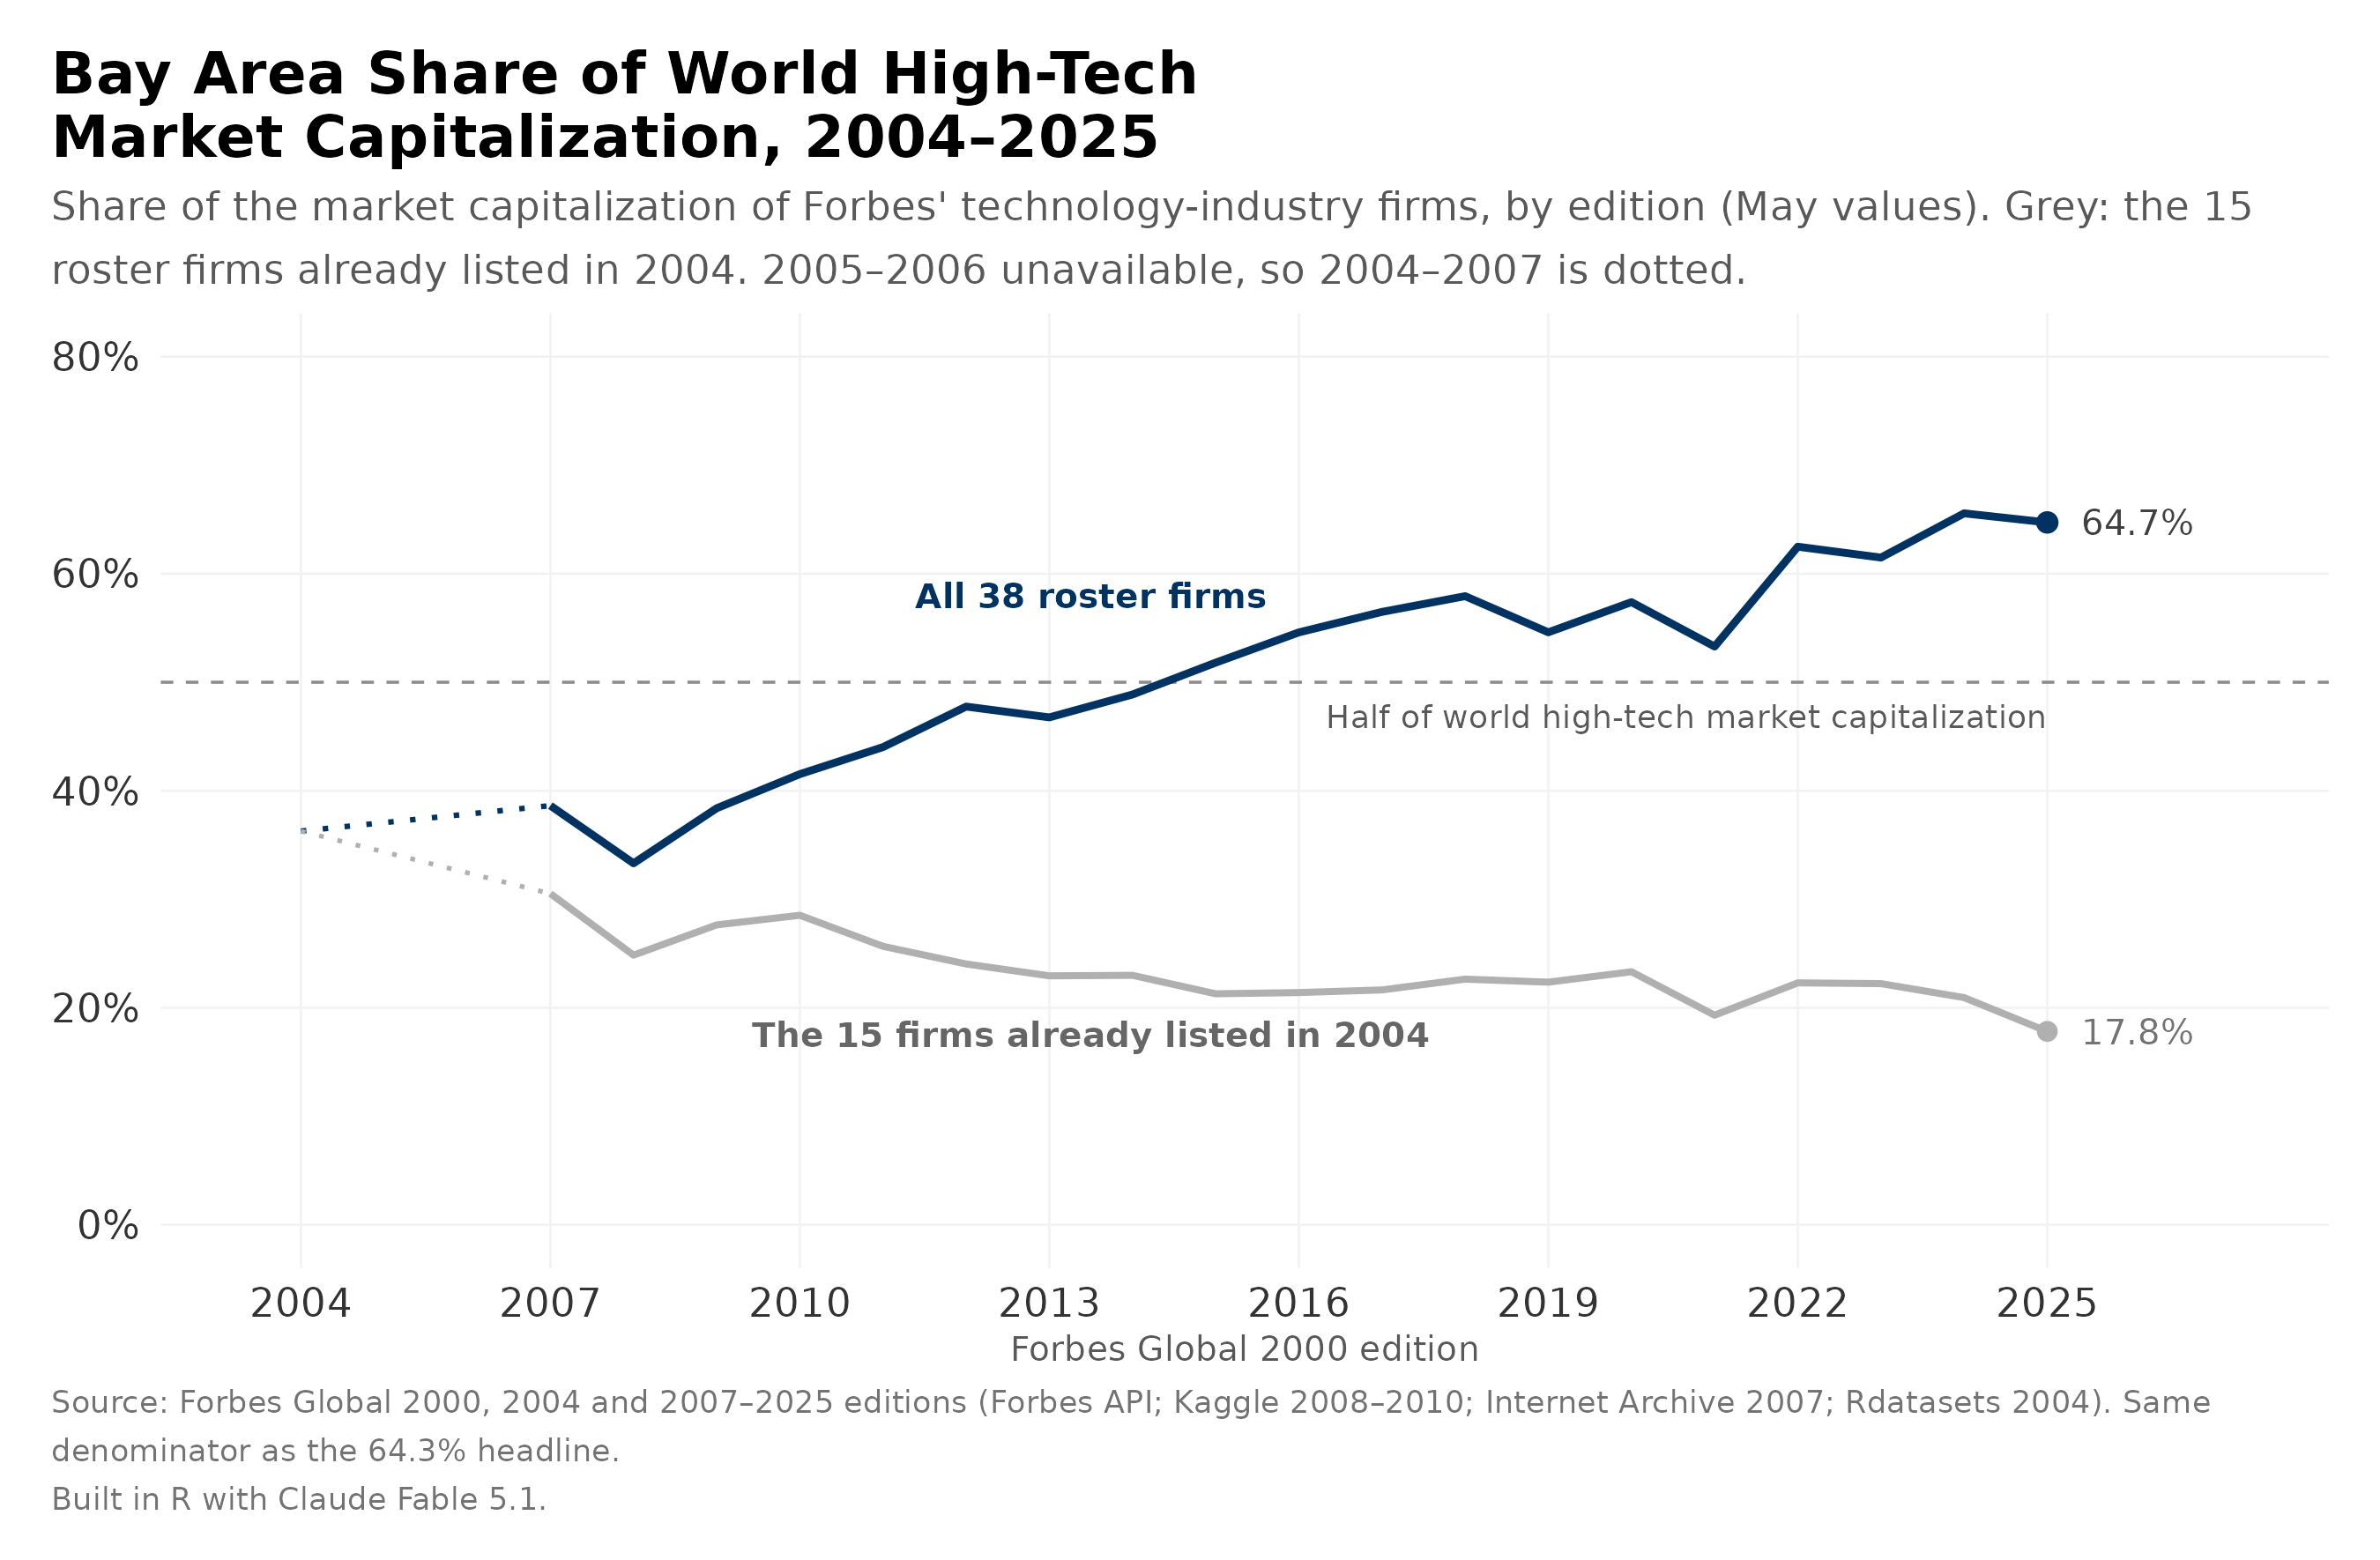
Since 2004, Bay Area technology firms have grown dramatically in scale and captured a larger share of the global high-tech market. In 2004, 15 of today’s 38 public firms were in the Forbes Global 2000; by 2025, the roster’s combined market capitalization had multiplied 22-fold, from $0.91 trillion to $20.1 trillion. Its share of the global high-tech market climbed over the same span, from about 36% to roughly 65%, as a result of new firms replacing old ones13. Three dips in the cluster’s share of world high-tech market capitalization occurred over the last two decades due to tech equities shifting during the 2008 Great Financial Crisis, the 2019 trade war, and the 2021 pandemic, but each was largely reversed within a year. In fact, during none of the three episodes did Bay Area market capitalization actually fall—the rest of the world’s market capitalization just grew faster; the dips are relative, not absolute.
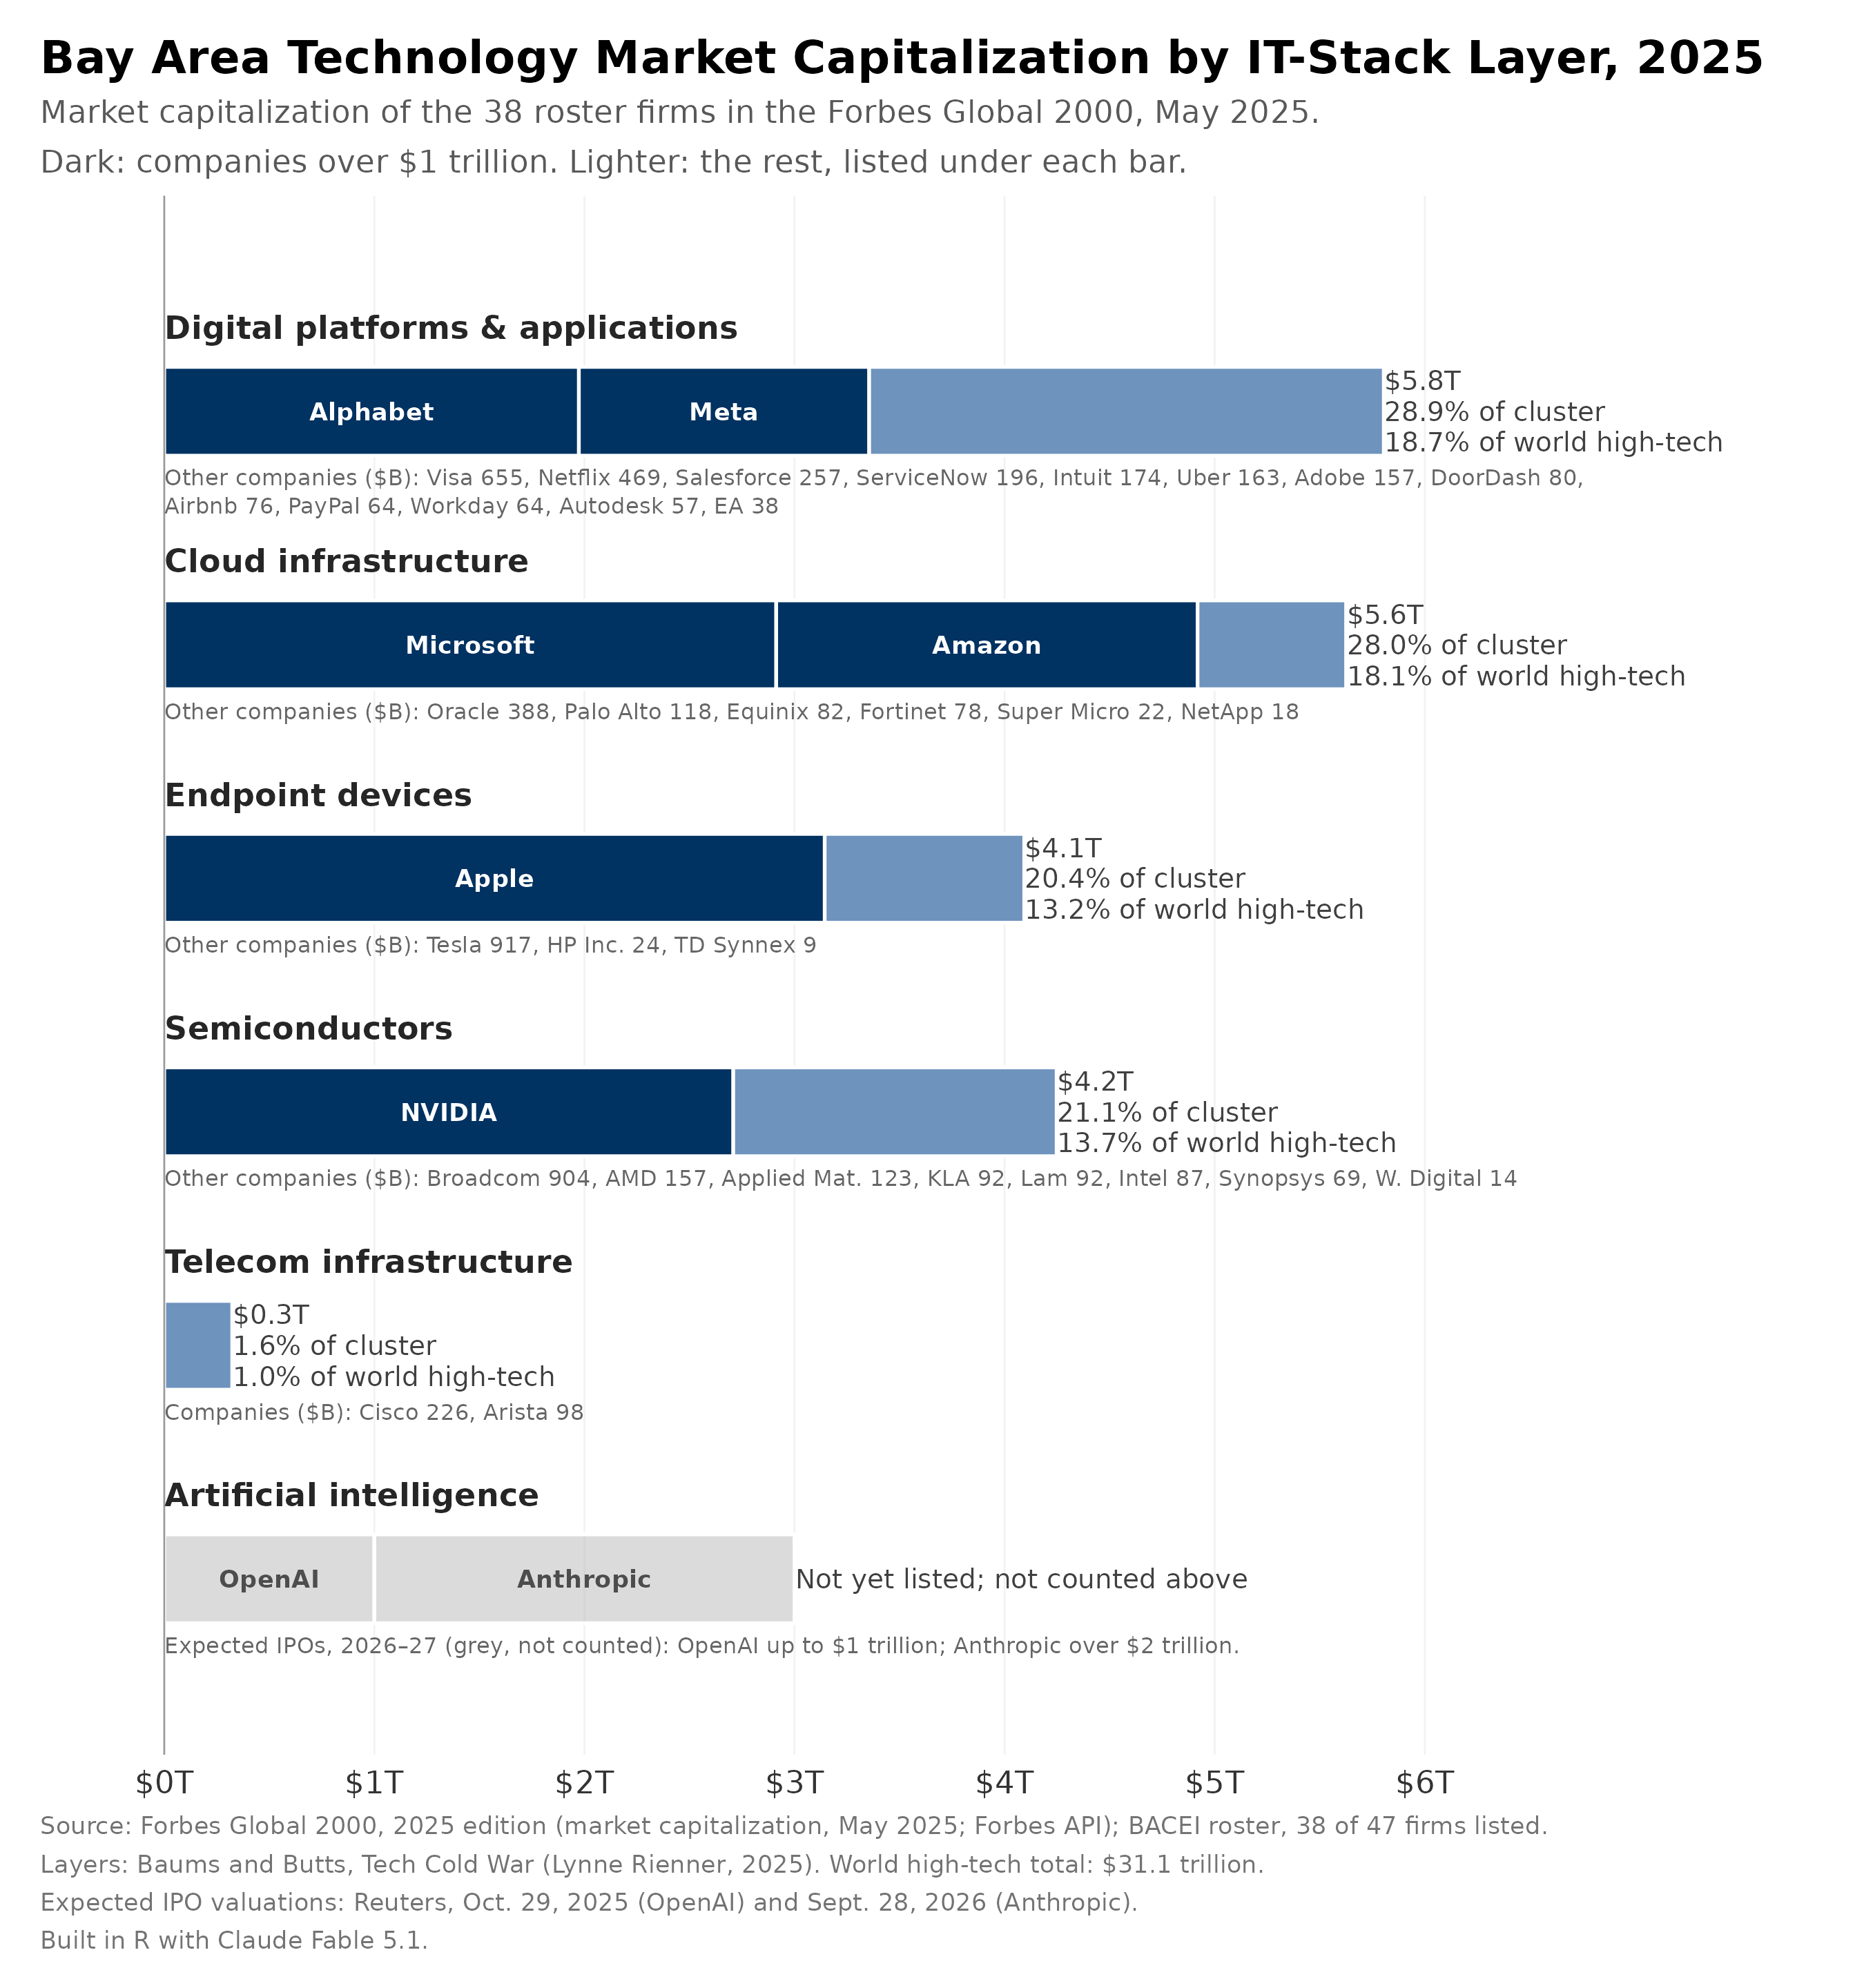
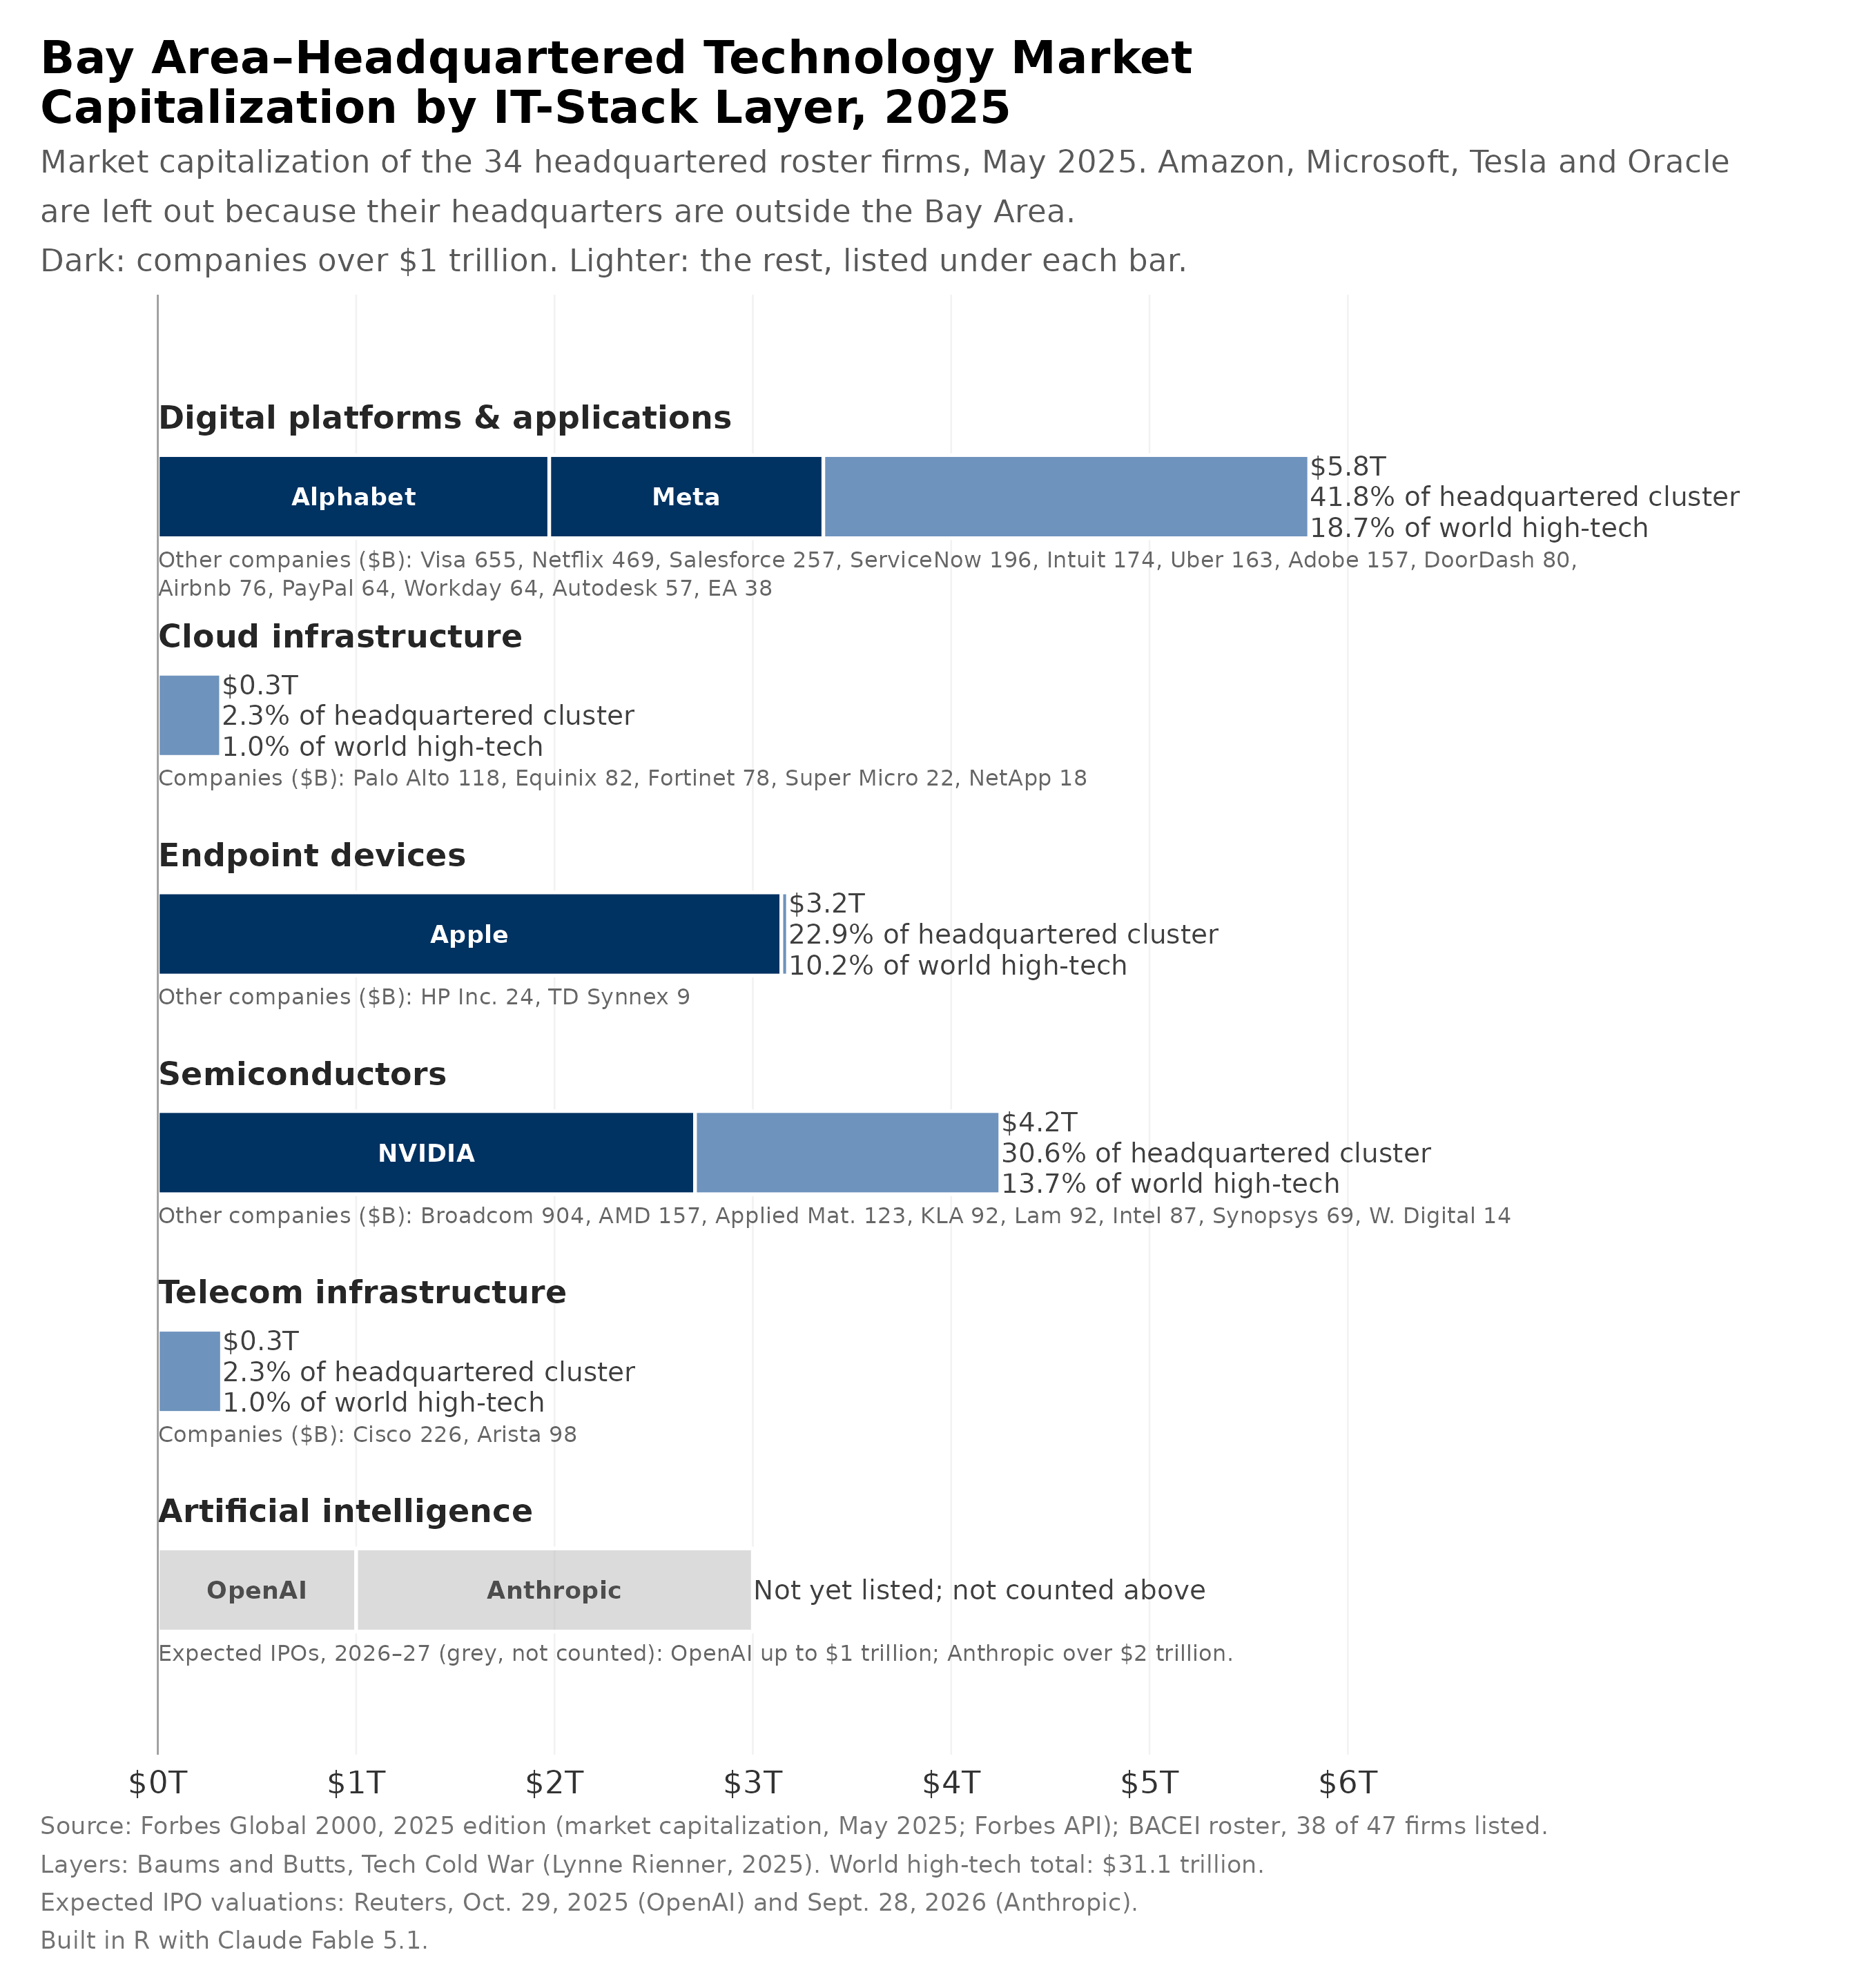
Which layers of the IT-Stack receive the highest share in high-technology investment? Break down the $20.1T cluster, whose tech-classified firms hold 64.7% of the entire world high-tech market capitalization. Digital platforms & applications 28.9% ($5.8T) and cloud infrastructure 28.0% ($5.6T) capture the most investment. Semiconductors 21.1% ($4.2T) and endpoint devices 20.4% ($4.1T) follow closely behind. Telecom 1.6% ($0.3T) nears the bottom. As of September 2026, no Bay Area frontier AI lab, e.g. Anthropic or OpenAI, has IPO’d, but both are targeting over $1 trillion market valuations14.
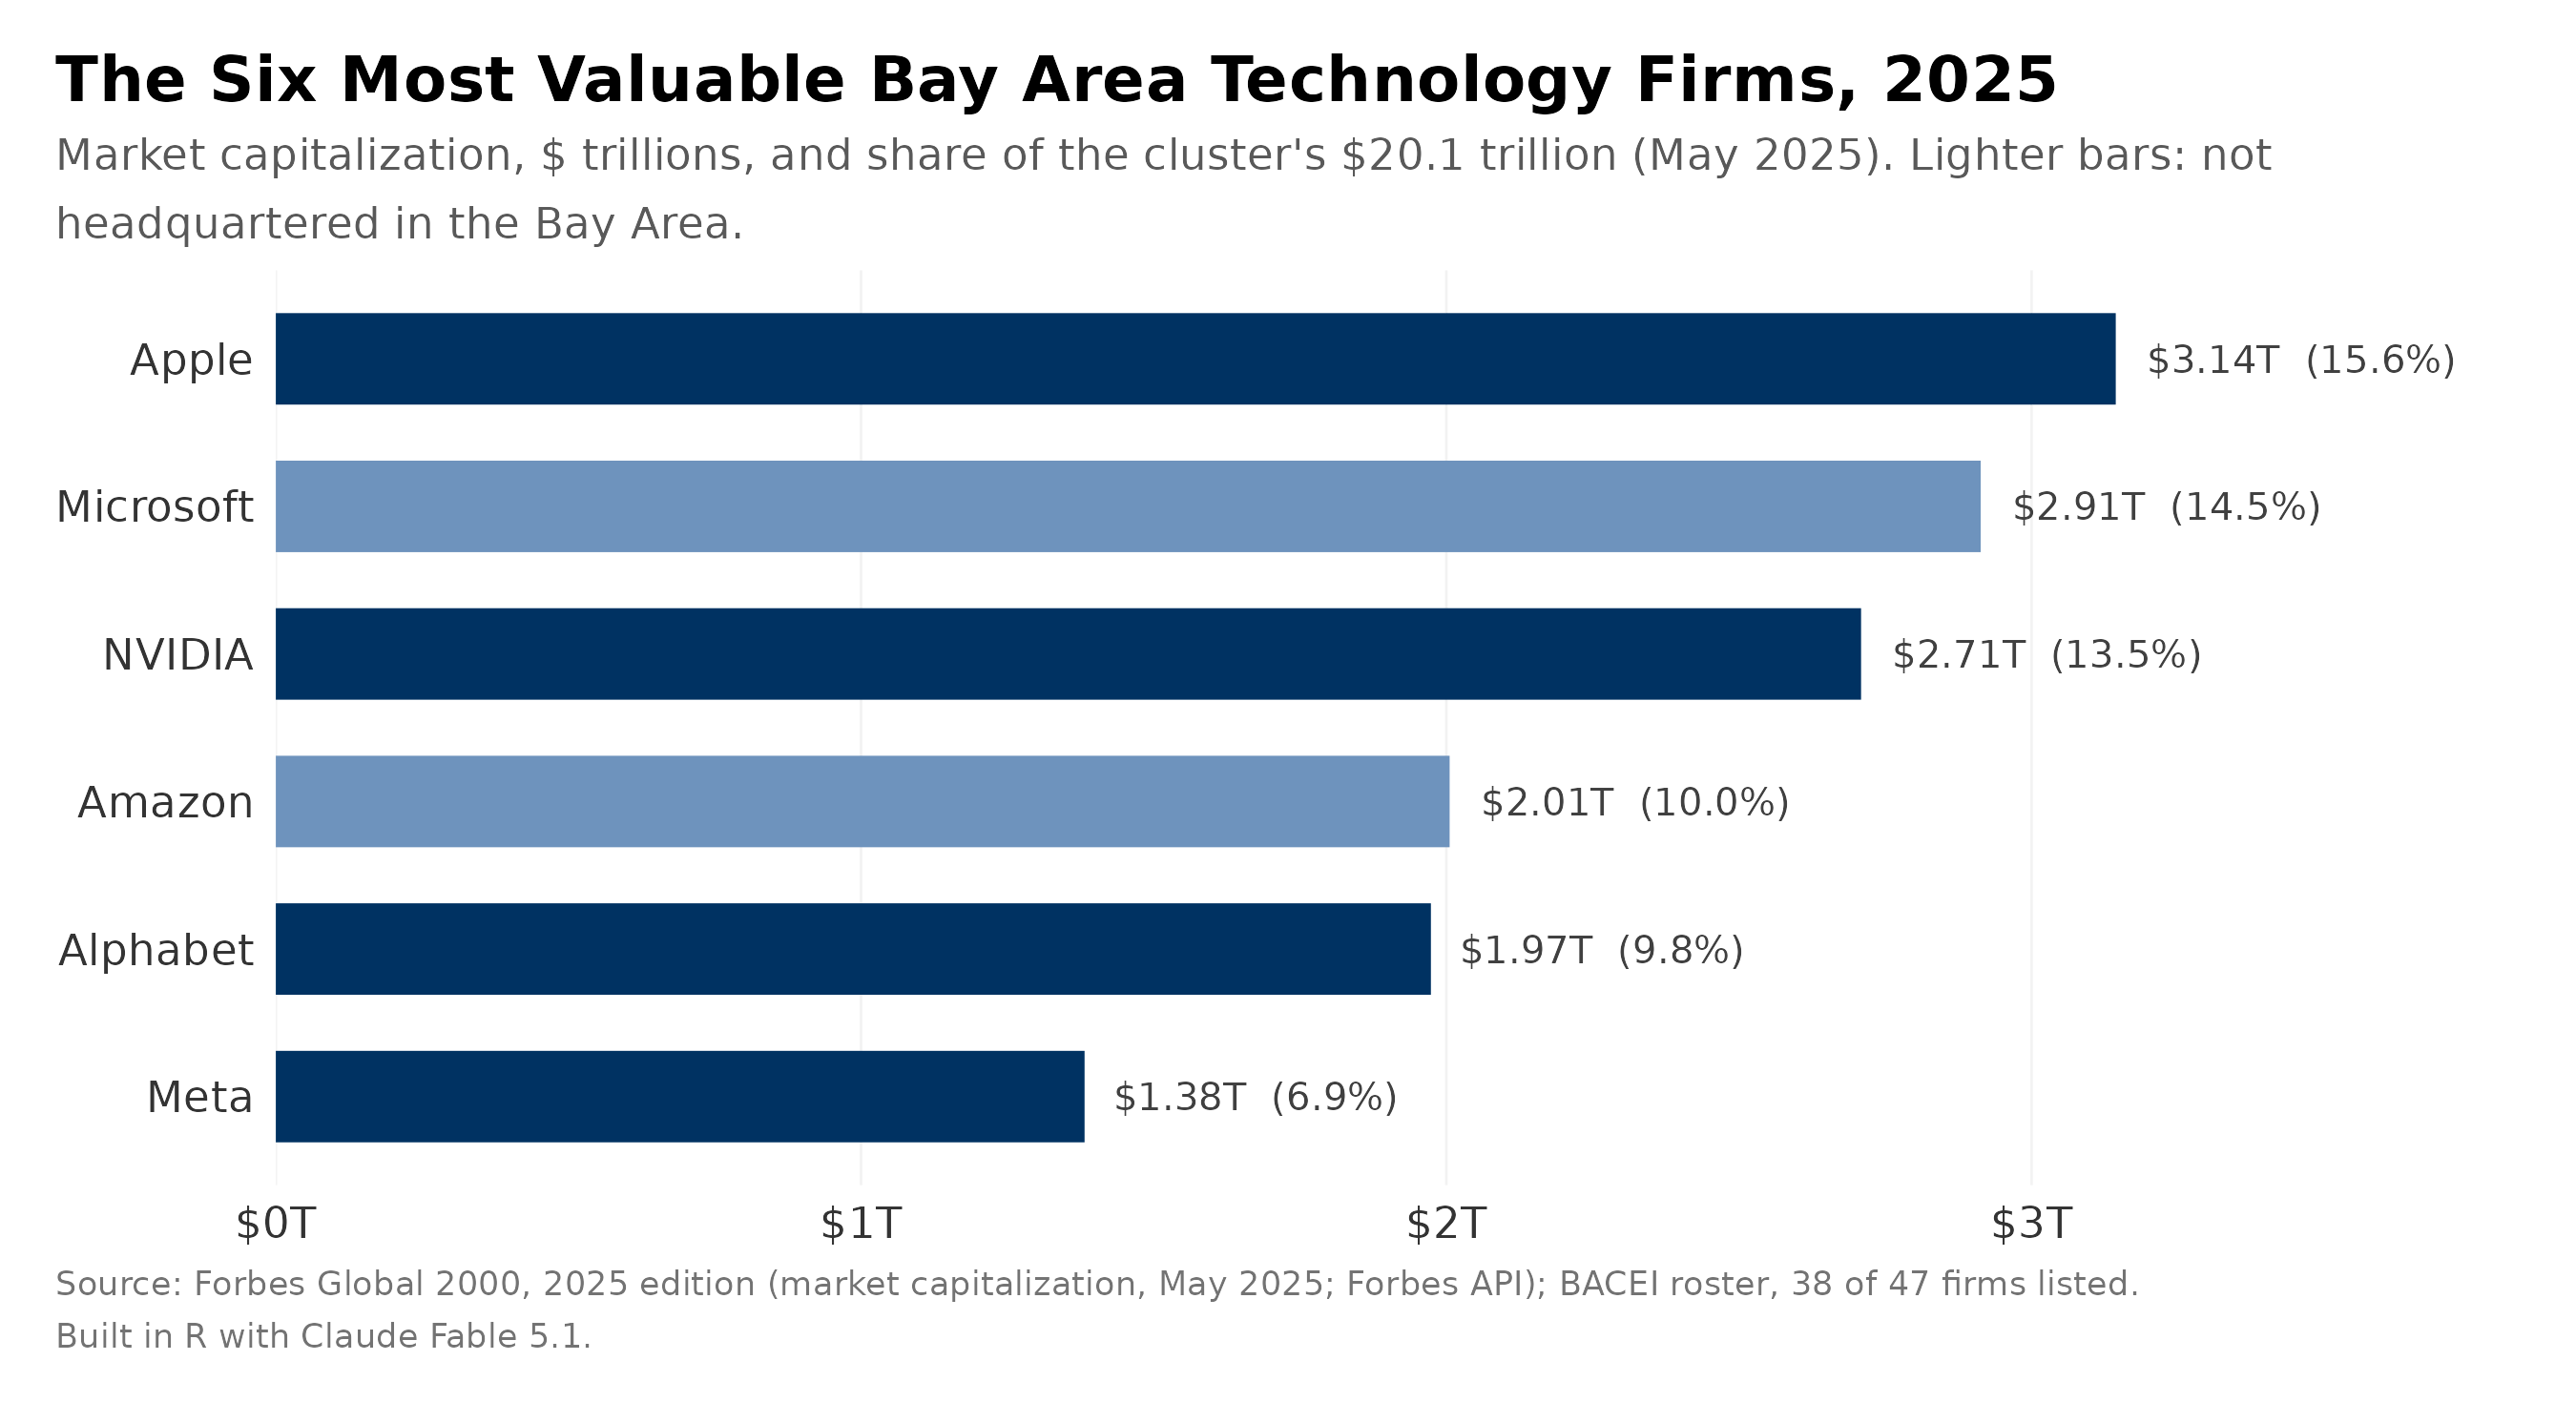
Investors remain resilient. Market capitalization data suggests geopolitics are not eroding confidence in the relative command of Bay Area technology flows. From 2004 to 2025, the roster’s share in the world’s high-tech global market capitalization rose from 36.3% to 64.7%. Capital has continued concentrating to the cluster even through geopolitical and economic tests: the great financial crisis, the trade war, the pandemic, and even after the recent rise in export controls, 65.6% in 2024. This concentration arises from the reinventive dynamism of the engine; the original 15 2004 firms fell from 36.3% to 17.8% as new entrants carried the rise. Each dip proved to be a blip where the cluster’s value still managed to grow.
Profit Power Remains Strong
With talent and investment established, how well the Bay Area can continue to commercialize its technologies abroad deserves deeper analysis. Commercialization in this report is defined as the ability to turn technology into profit. If Bay Area technology companies were struggling to commercialize their technology—to convert innovation into profit—global profit-share data would show it.
Strong profits suggest Bay Area technology companies remain among the world’s best at commercializing their technology. One of every two dollars in global high-tech profit is earned by the 38 Bay Area technology companies in the Forbes Global 2000.1516 Their centrality to the world trade of frontier technologies testifies to the ubiquity of their current economic activity. Unlike revenue, higher profits indicate a company's ability to perform above its costs—signaling the capacity to continually invest in research and development and enter new markets.17
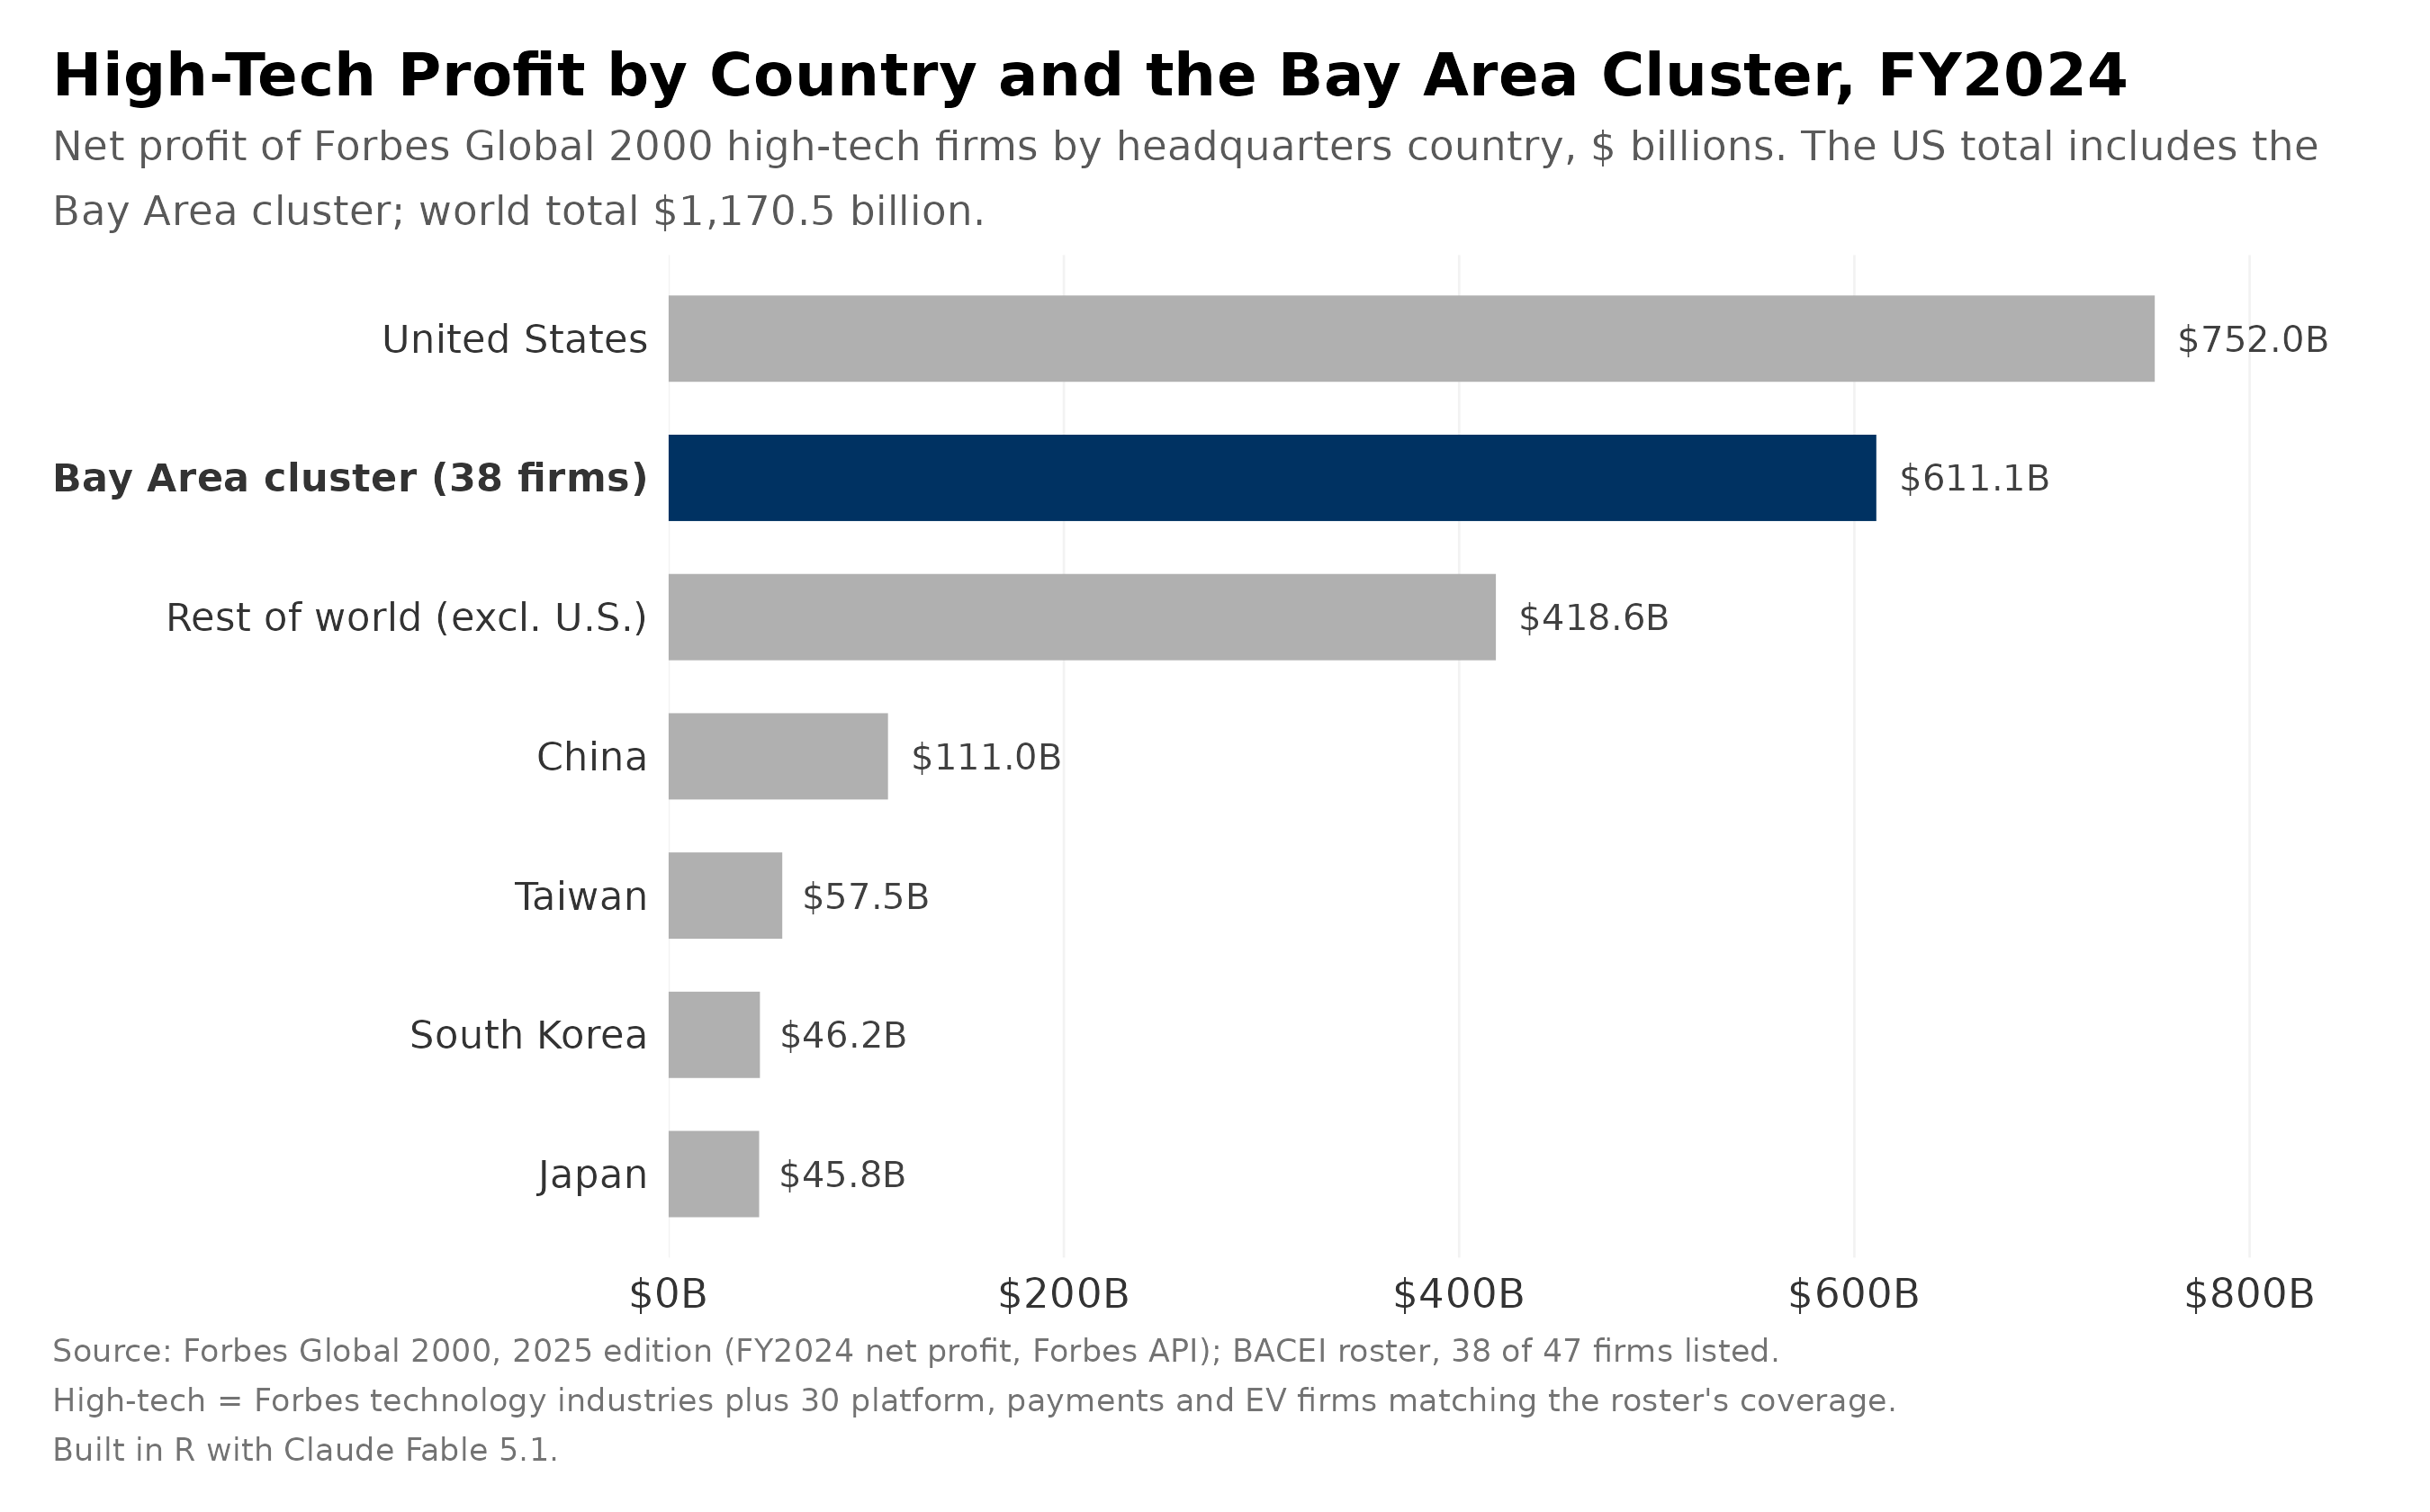
If this cluster of Bay Area companies were its own country, it would generate more profit than every other nation’s high-tech sector combined, excluding the rest of the United States. The $611.1 billion in FY2024 is more than five times China’s total ($111.0 billion) and more than ten times Taiwan’s ($57.5 billion).
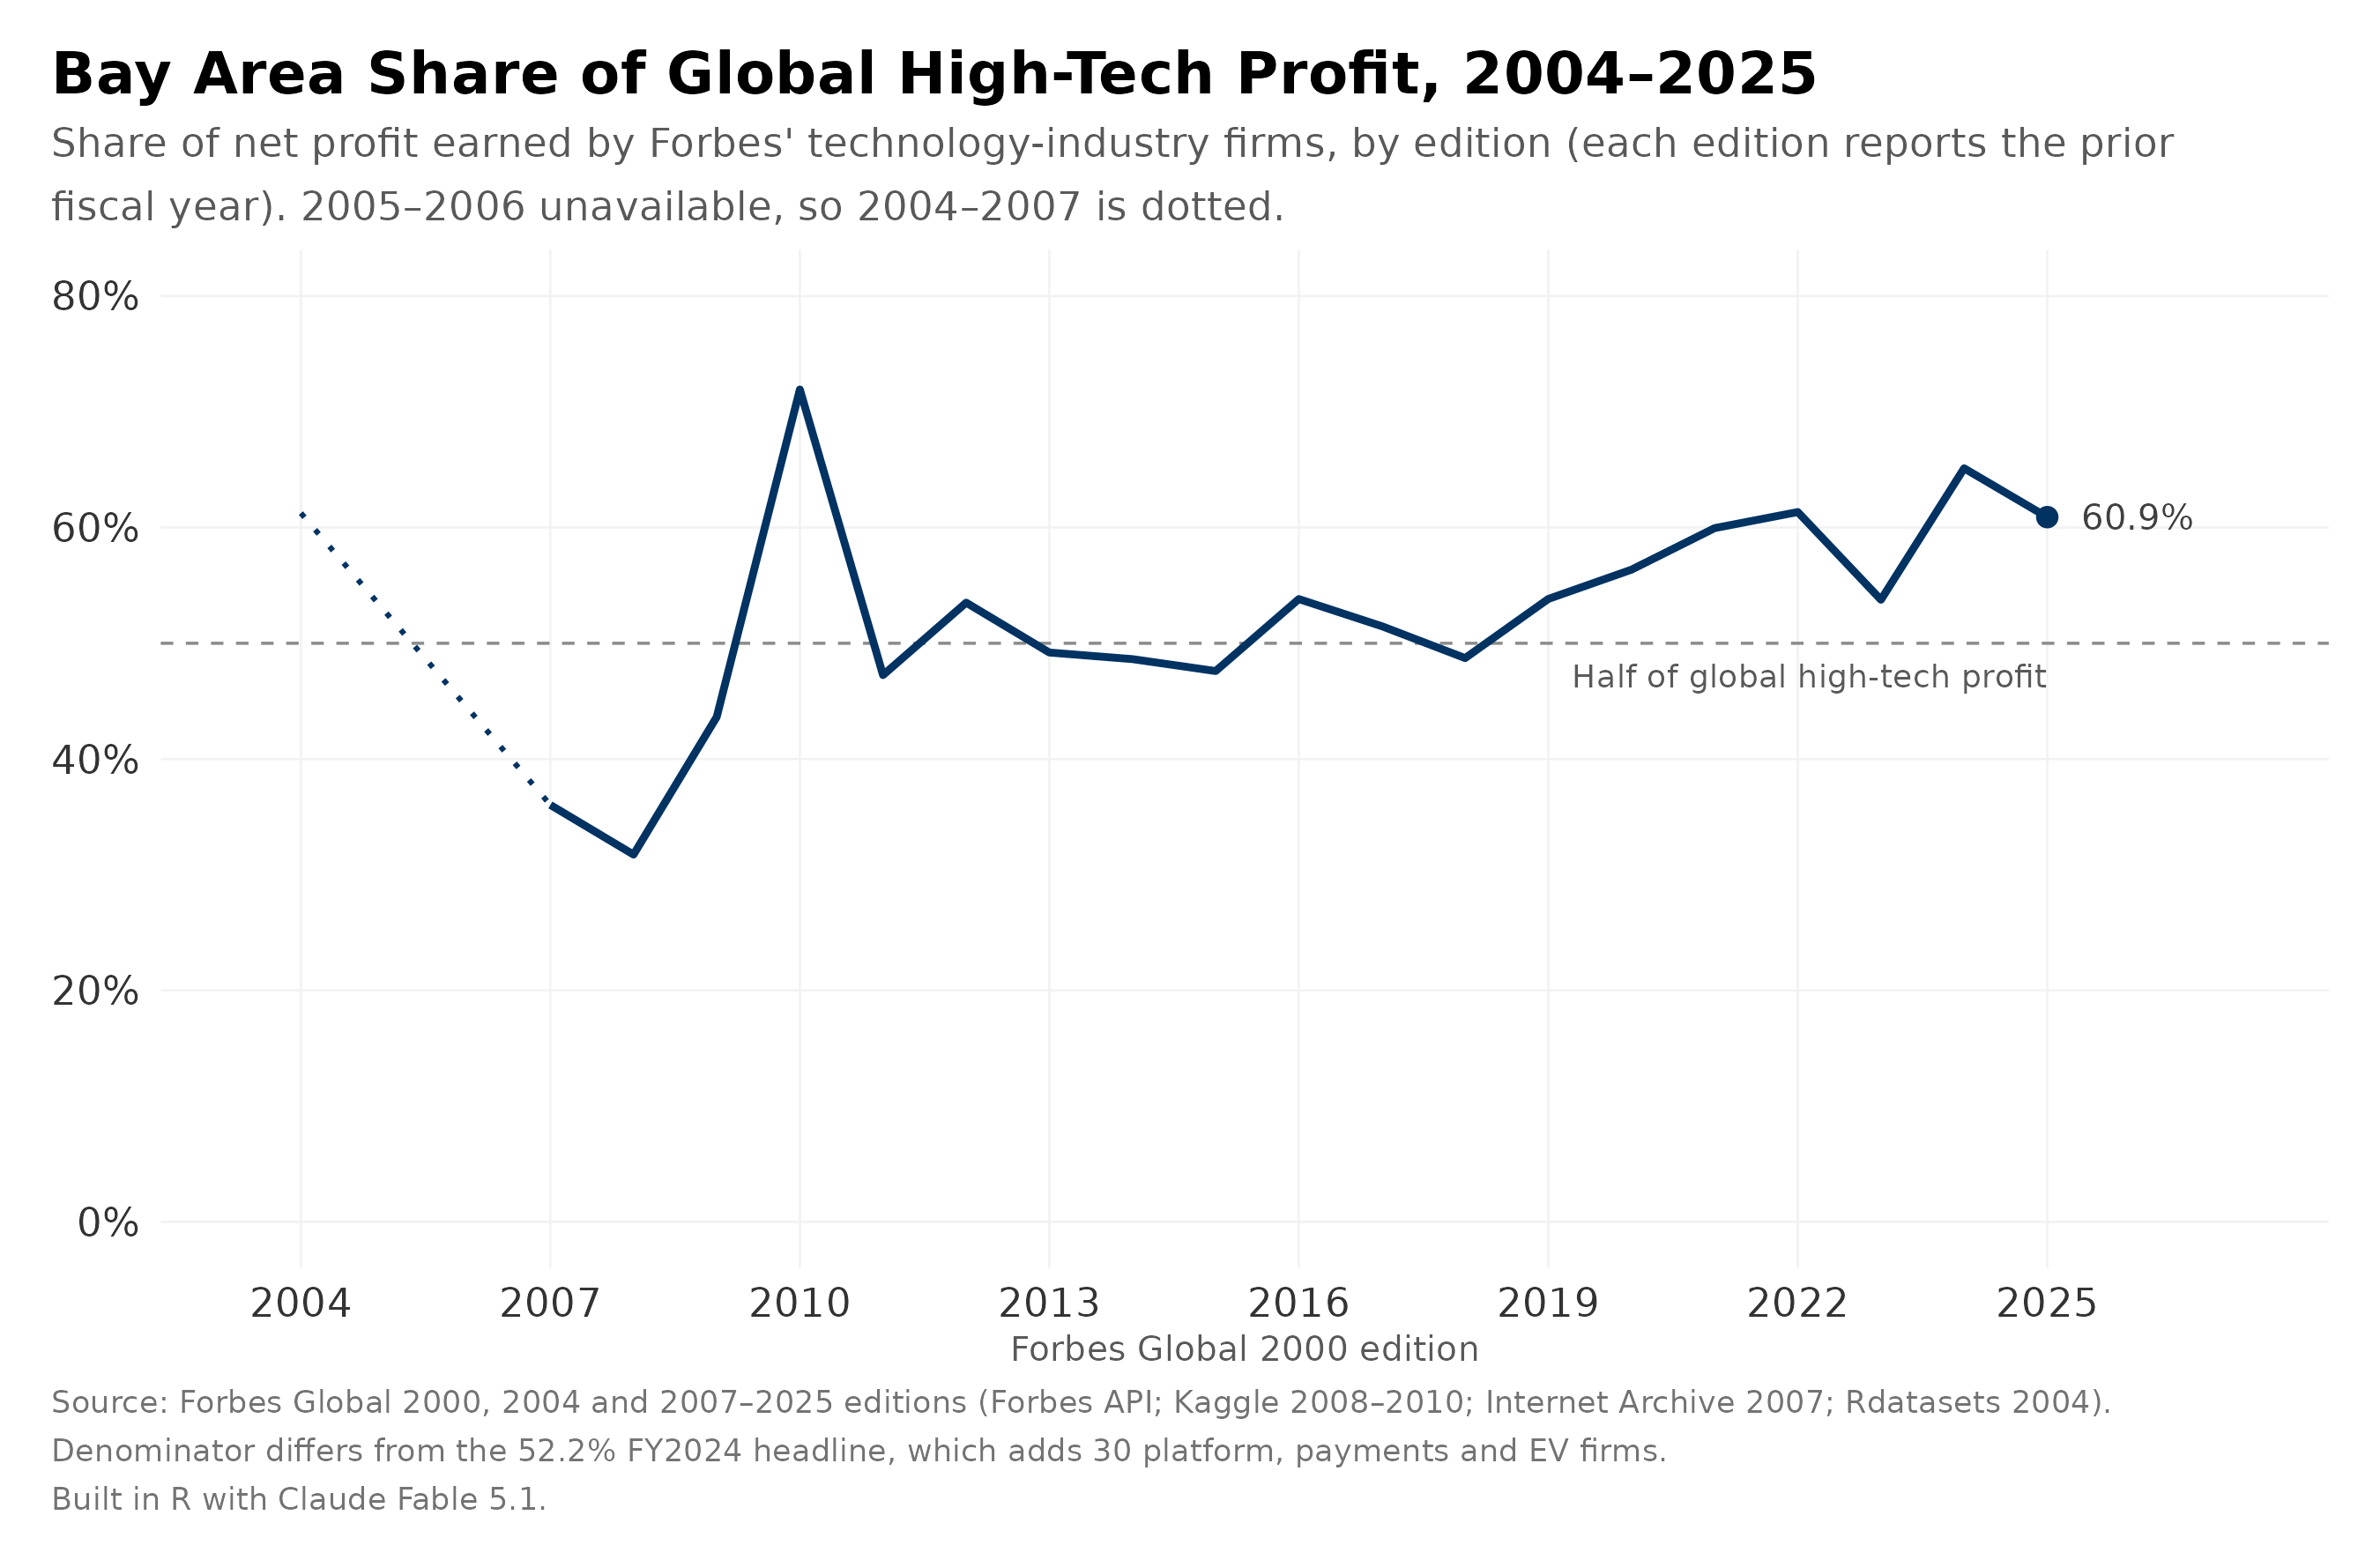
Observing profit capture over time, the pattern holds. This reflects a long-running trend of capturing commercial value: Bay Area technology firms have increased their profits over time by splitting their value chains into low-value assembly and high-value branding, research, and development. Since 2019, the Bay Area cluster’s share of global profits in the Forbes 2000 list has never dropped below half.18
This chart reflects how corporations continue to divide labor internationally in what many characterize as a “merchant” model: companies like Cisco and NVIDIA handle design and quality control in the Bay Area while outsourcing production and assembly elsewhere.19 Firms treat this assembly work as interchangeable, low-cost input, while retaining the bulk of the profits for themselves. For example, a 2023 teardown revealed the Apple iPhone 15 Pro Max retails for $1,199, but costs only $523 to produce across several countries, of which less than $13 goes to firms in China for assembly and components.20
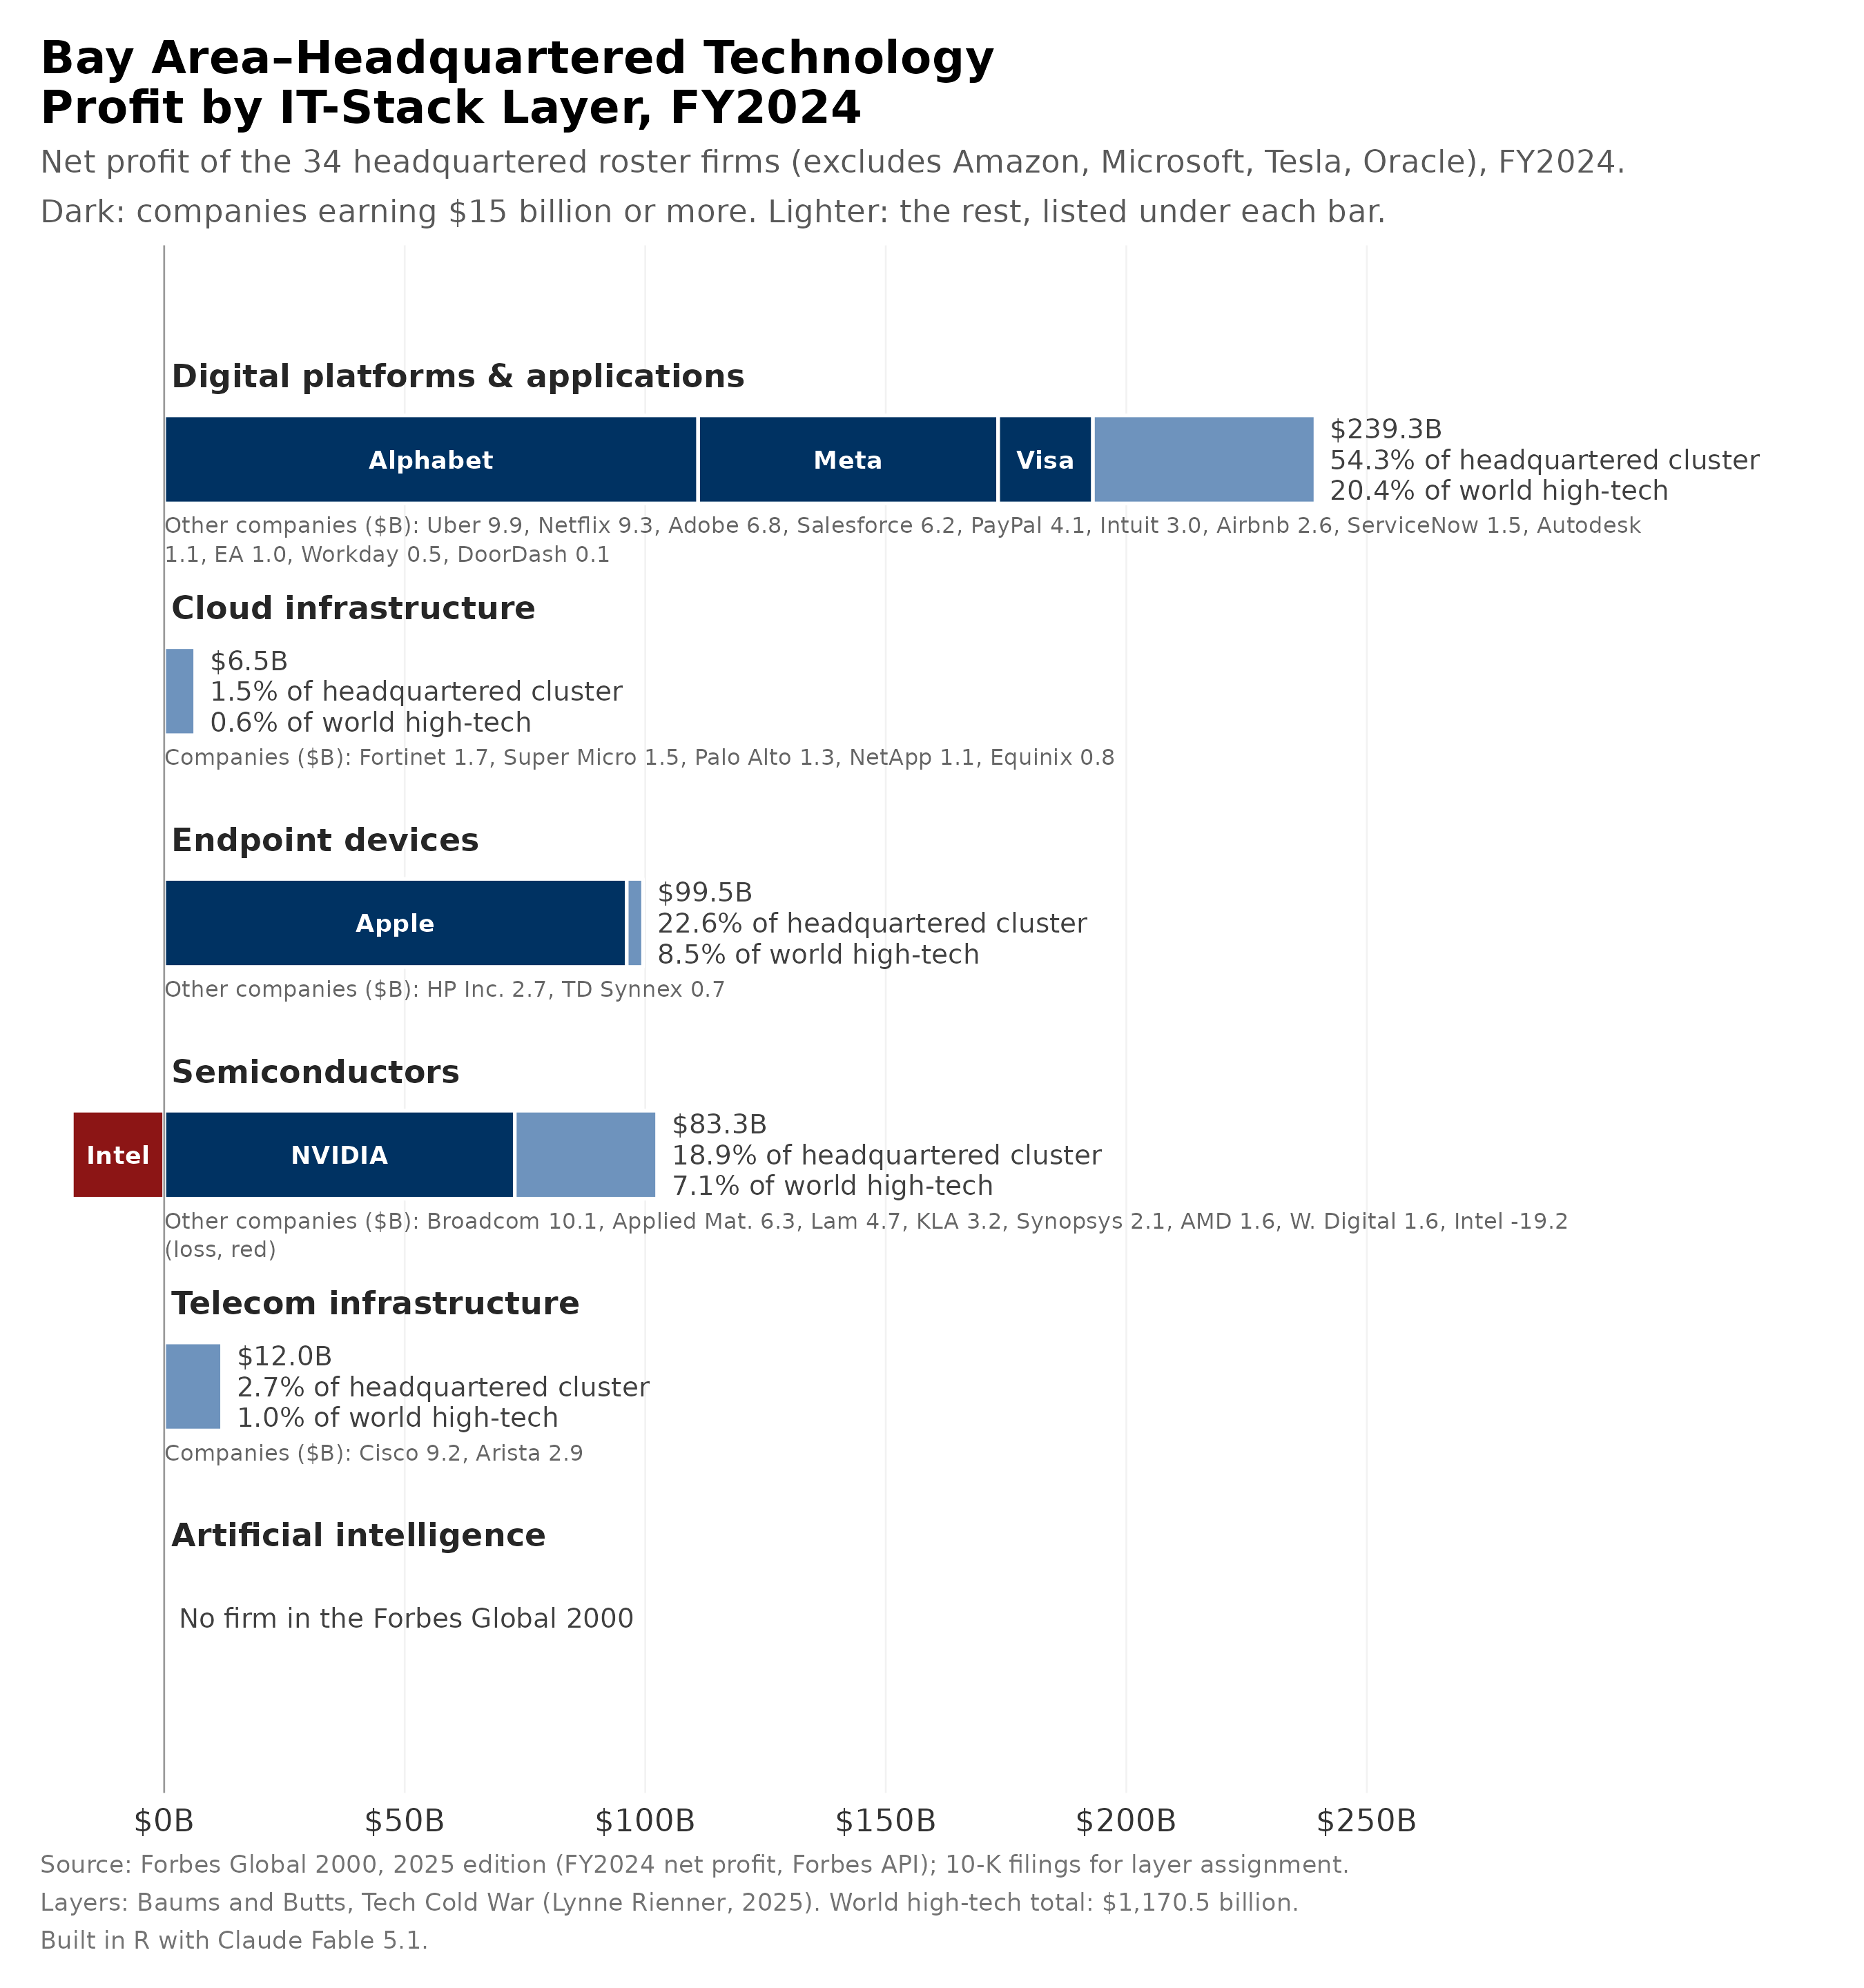
Which layer in the IT stack captures the highest share of profits?21 The companies whose core product is digital platforms & applications capture the most, 20.4% of world high-tech profits and 39.2% of the cluster. Cloud infrastructure follows (14.6% of world and 27.9% of cluster). When excluding the major non-headquartered Bay Area operators, cloud companies, including Microsoft and Amazon, dry up the category almost entirely. Endpoint devices (9.0% of world and 17.3% of cluster) and semiconductors (7.1% of world and 13.6% of cluster) follow.22 The Artificial Intelligence layer remains empty as frontier labs are private so they do not appear in the Forbes Global 2000.
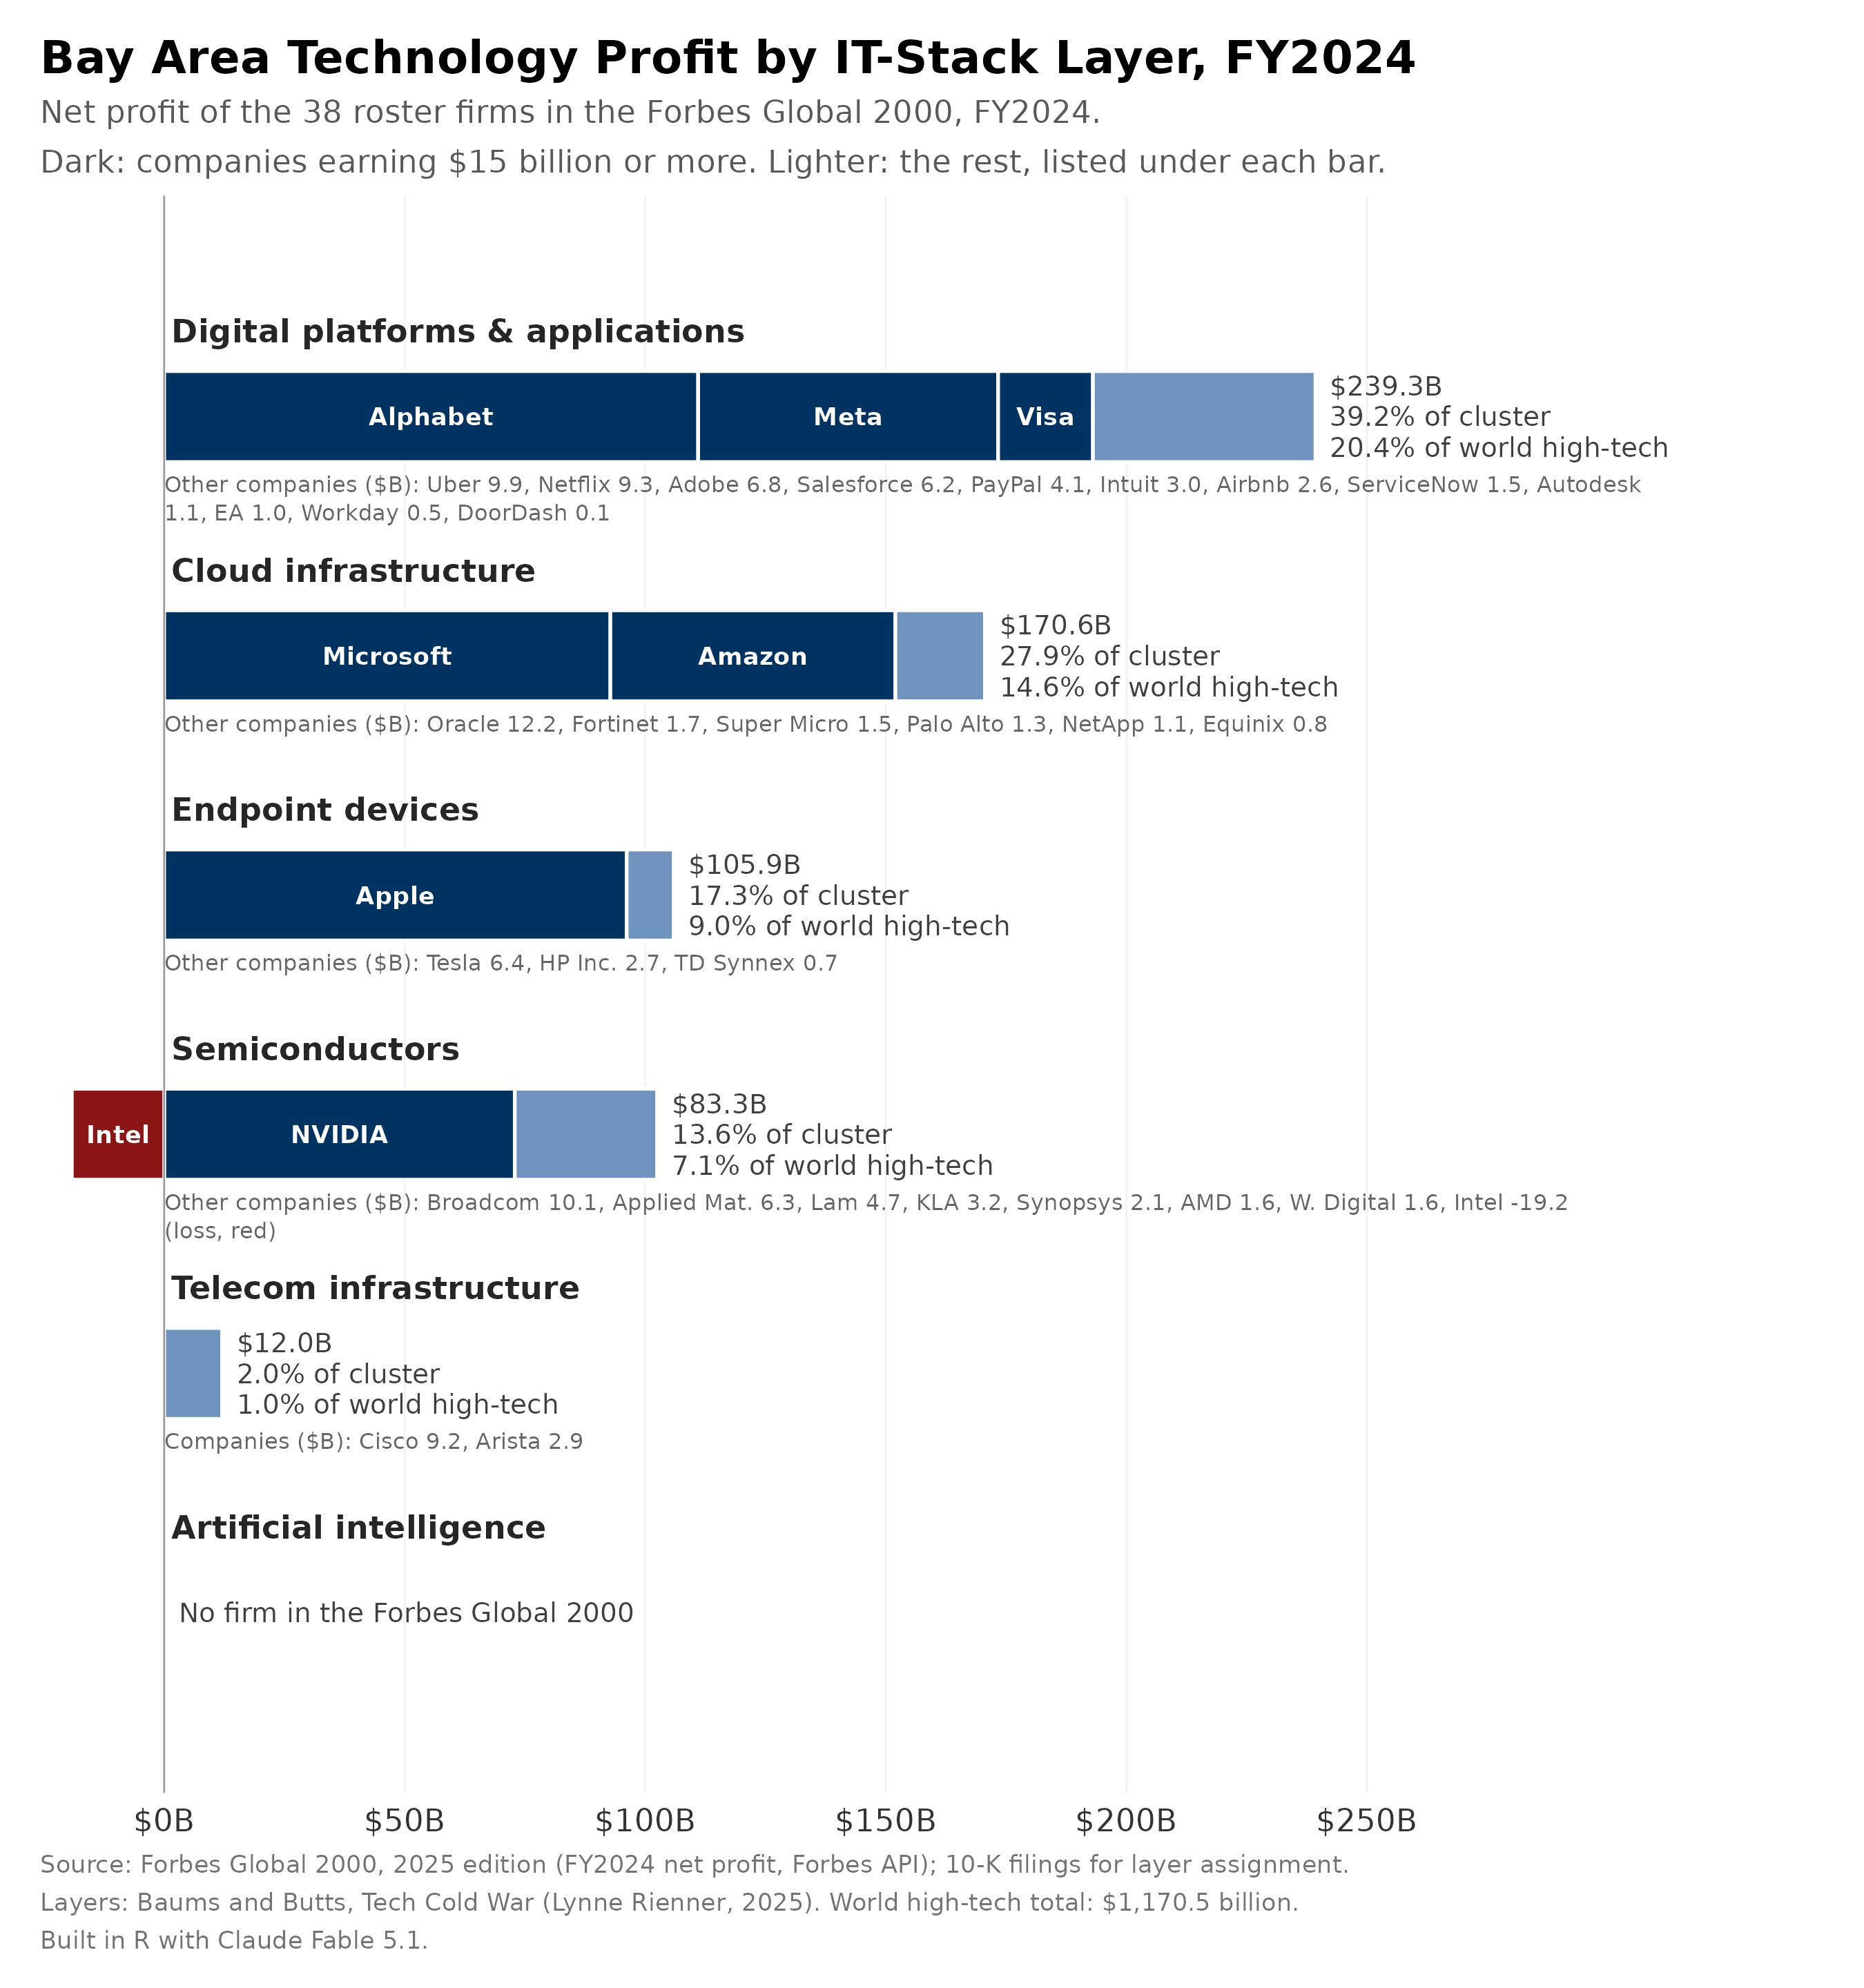
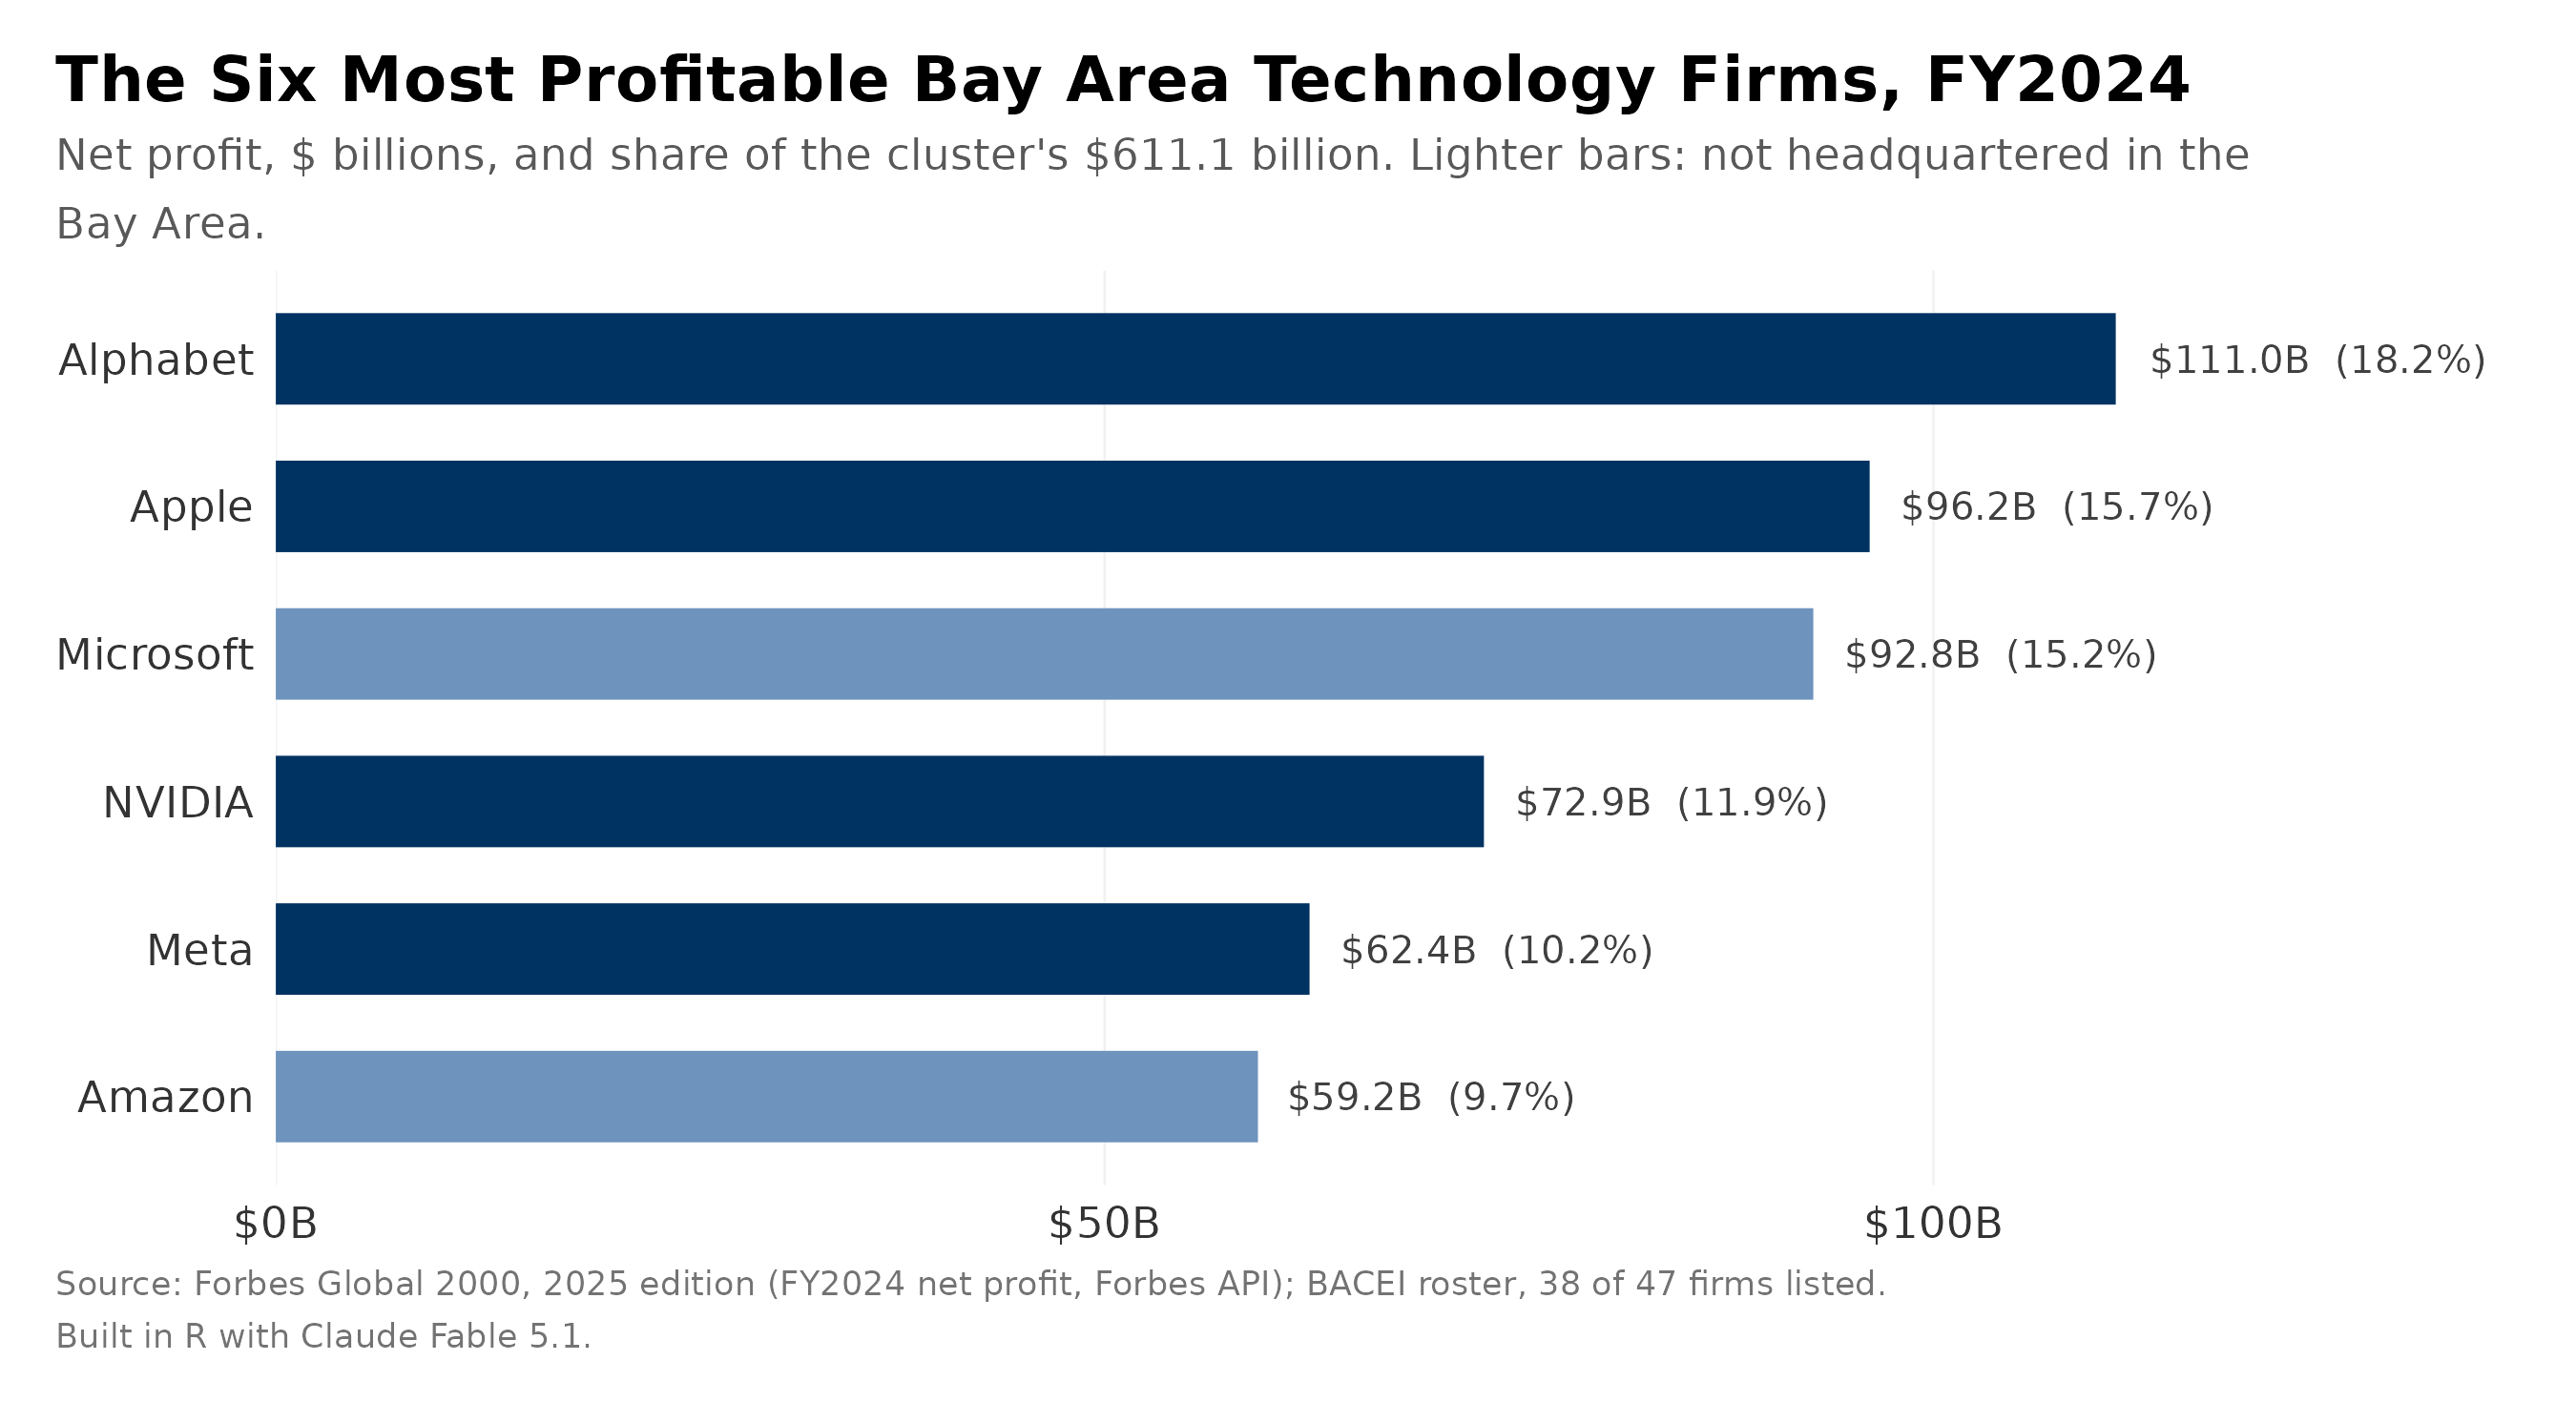
Recognizable names emerge when these business lines are examined at the company level. The six largest companies alone account for 80.9% of the cluster’s profits: Alphabet ($111.0B), Apple ($96.2B), Microsoft ($92.8B), NVIDIA ($72.9B), Meta ($62.4B), and Amazon ($59.2B), on a Forbes Global 2000 basis.
Excluding the four firms that are not headquartered but have major operations in the Bay Area—Amazon, Microsoft, Tesla, and Oracle—the cluster’s share of global high-technology profit falls from roughly half (52.2%) to about a third (37.6%). A steep drop-off follows the remaining top five, with the list consolidating quickly until Visa closes out the top tier at $19.7 billion.
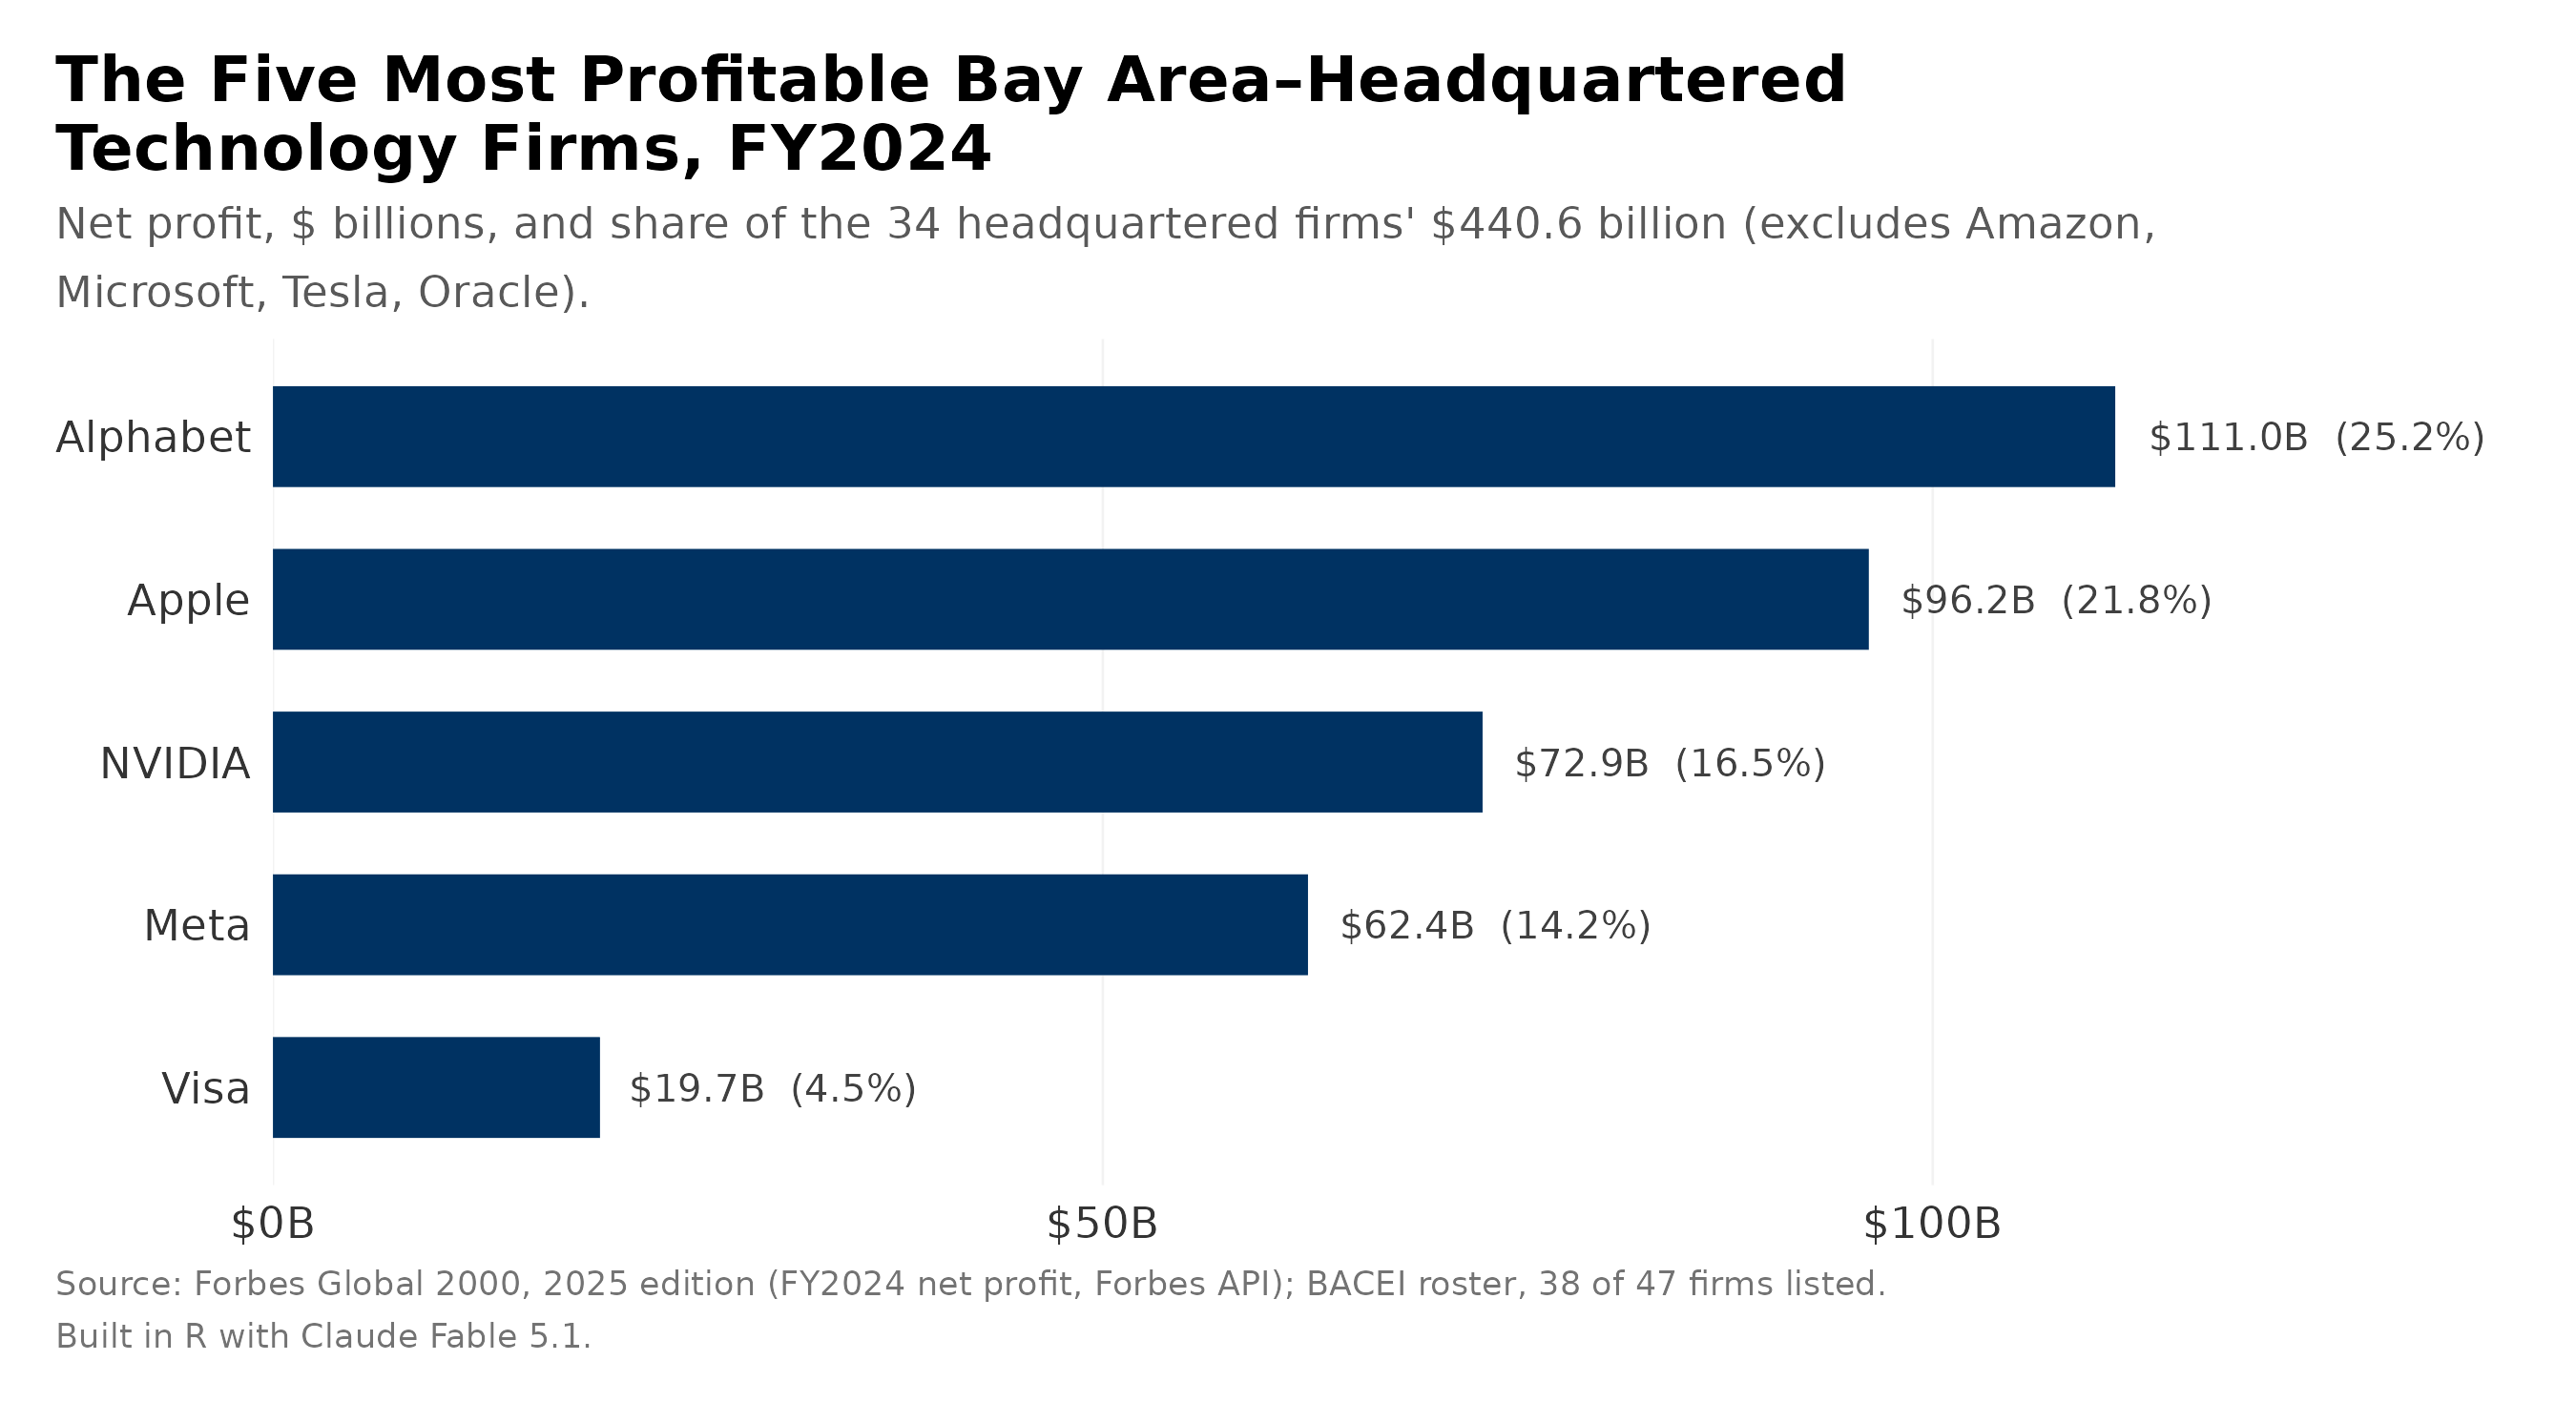
Drawbacks. Several limitations exist in relying on profit-share to assess whether technology flows are fragmenting. First, firms are not required to standardize where in the world they report earning profit—metrics like customer location, billing entity, or shipping destination would be more informative but are not consistently disclosed. Second, profits fluctuate year to year, which complicates any read on which firms hold durable power; some companies go unprofitable for years while prioritizing growth.23 Third, aggregate profit share obscures the rise and fall of individual firms within the Forbes Global 2000 list over time, which argues for examining several time series rather than a single snapshot. Finally, the metric is highly sensitive to a small number of firms: the top five companies represent 71.2% of total Bay Area high-tech profits, and NVIDIA alone accounts for nearly 12% of the cluster’s total—meaning a shock to NVIDIA’s addressable market could meaningfully move the cluster-wide statistic on its own.
These profit metrics suggest little fragmentation at the level of commercializing their products. Roughly half of the world’s high-tech profit is earned by Bay Area technology companies. Its top six firms earn 81% of the entire cluster’s profit and NVIDIA alone earns 12% of the roster’s profit. This suggests that while the dominance is apparent, a handful of firms carry the cluster’s profitability. Were geopolitics to disrupt any of these firms’ core business lines, the impact to the Bay Area’s profit power would immediately show, reverberating back on the region’s dynamism to research, develop, and invest in successive waves of innovation.24
Chapter 9: Assessing Exposure
Having tested the strength of the Bay Area’s engine, this section turns to testing exposure: is this engine exposed to fragmentation? To test commercial activity, one basket of metrics observes a firm’s level of “transnationality”, the degree to which a firm’s commercial activity is earned at home versus overseas. Traditional performance-based measures include foreign sales to total sales (FSTS) and foreign profits as a share of total profit (FPTP).25 Fragmentation would appear in foreign profit share falling (FPTP), as the share in commercial activity would shift towards home.
Profits Come Home, at Least on Paper
Global profit-share speaks to the Bay Area’s continued prowess to commercialize the frontier; the Bay Area earns more high technology profit than other clusters around the world, but this does not reveal how exposed their earnings are. The United States boasts one of the largest and most-profitable economies in the world. The commercial strength of its companies could rest upon the ability to generate profits at home and not abroad.
This section offers a basic metric that splits whether profits are earned in the United States or abroad. By focusing on FPTP, it extends the earlier profit analysis and works within the data available in 10-K filings.26 Most in the dataset report a domestic-versus-foreign split in their SEC 10-Ks. Of the 47 roster firms, 31 reported a usable ratio. According to their FY2024 10-Ks, 22.9% of total pretax income was earned abroad, $133.5 billion of $584.2 billion. The median firm’s share is higher than the average, 37.4%, as the largest earners book the smallest share abroad: Alphabet, Meta, NVIDIA, Amazon and Microsoft earn 77.2% of the 31 firms’ pretax income and report 16.5% of it as foreign.27 The more transnational a firm’s activity, the more exposed it is to geopolitical risks.
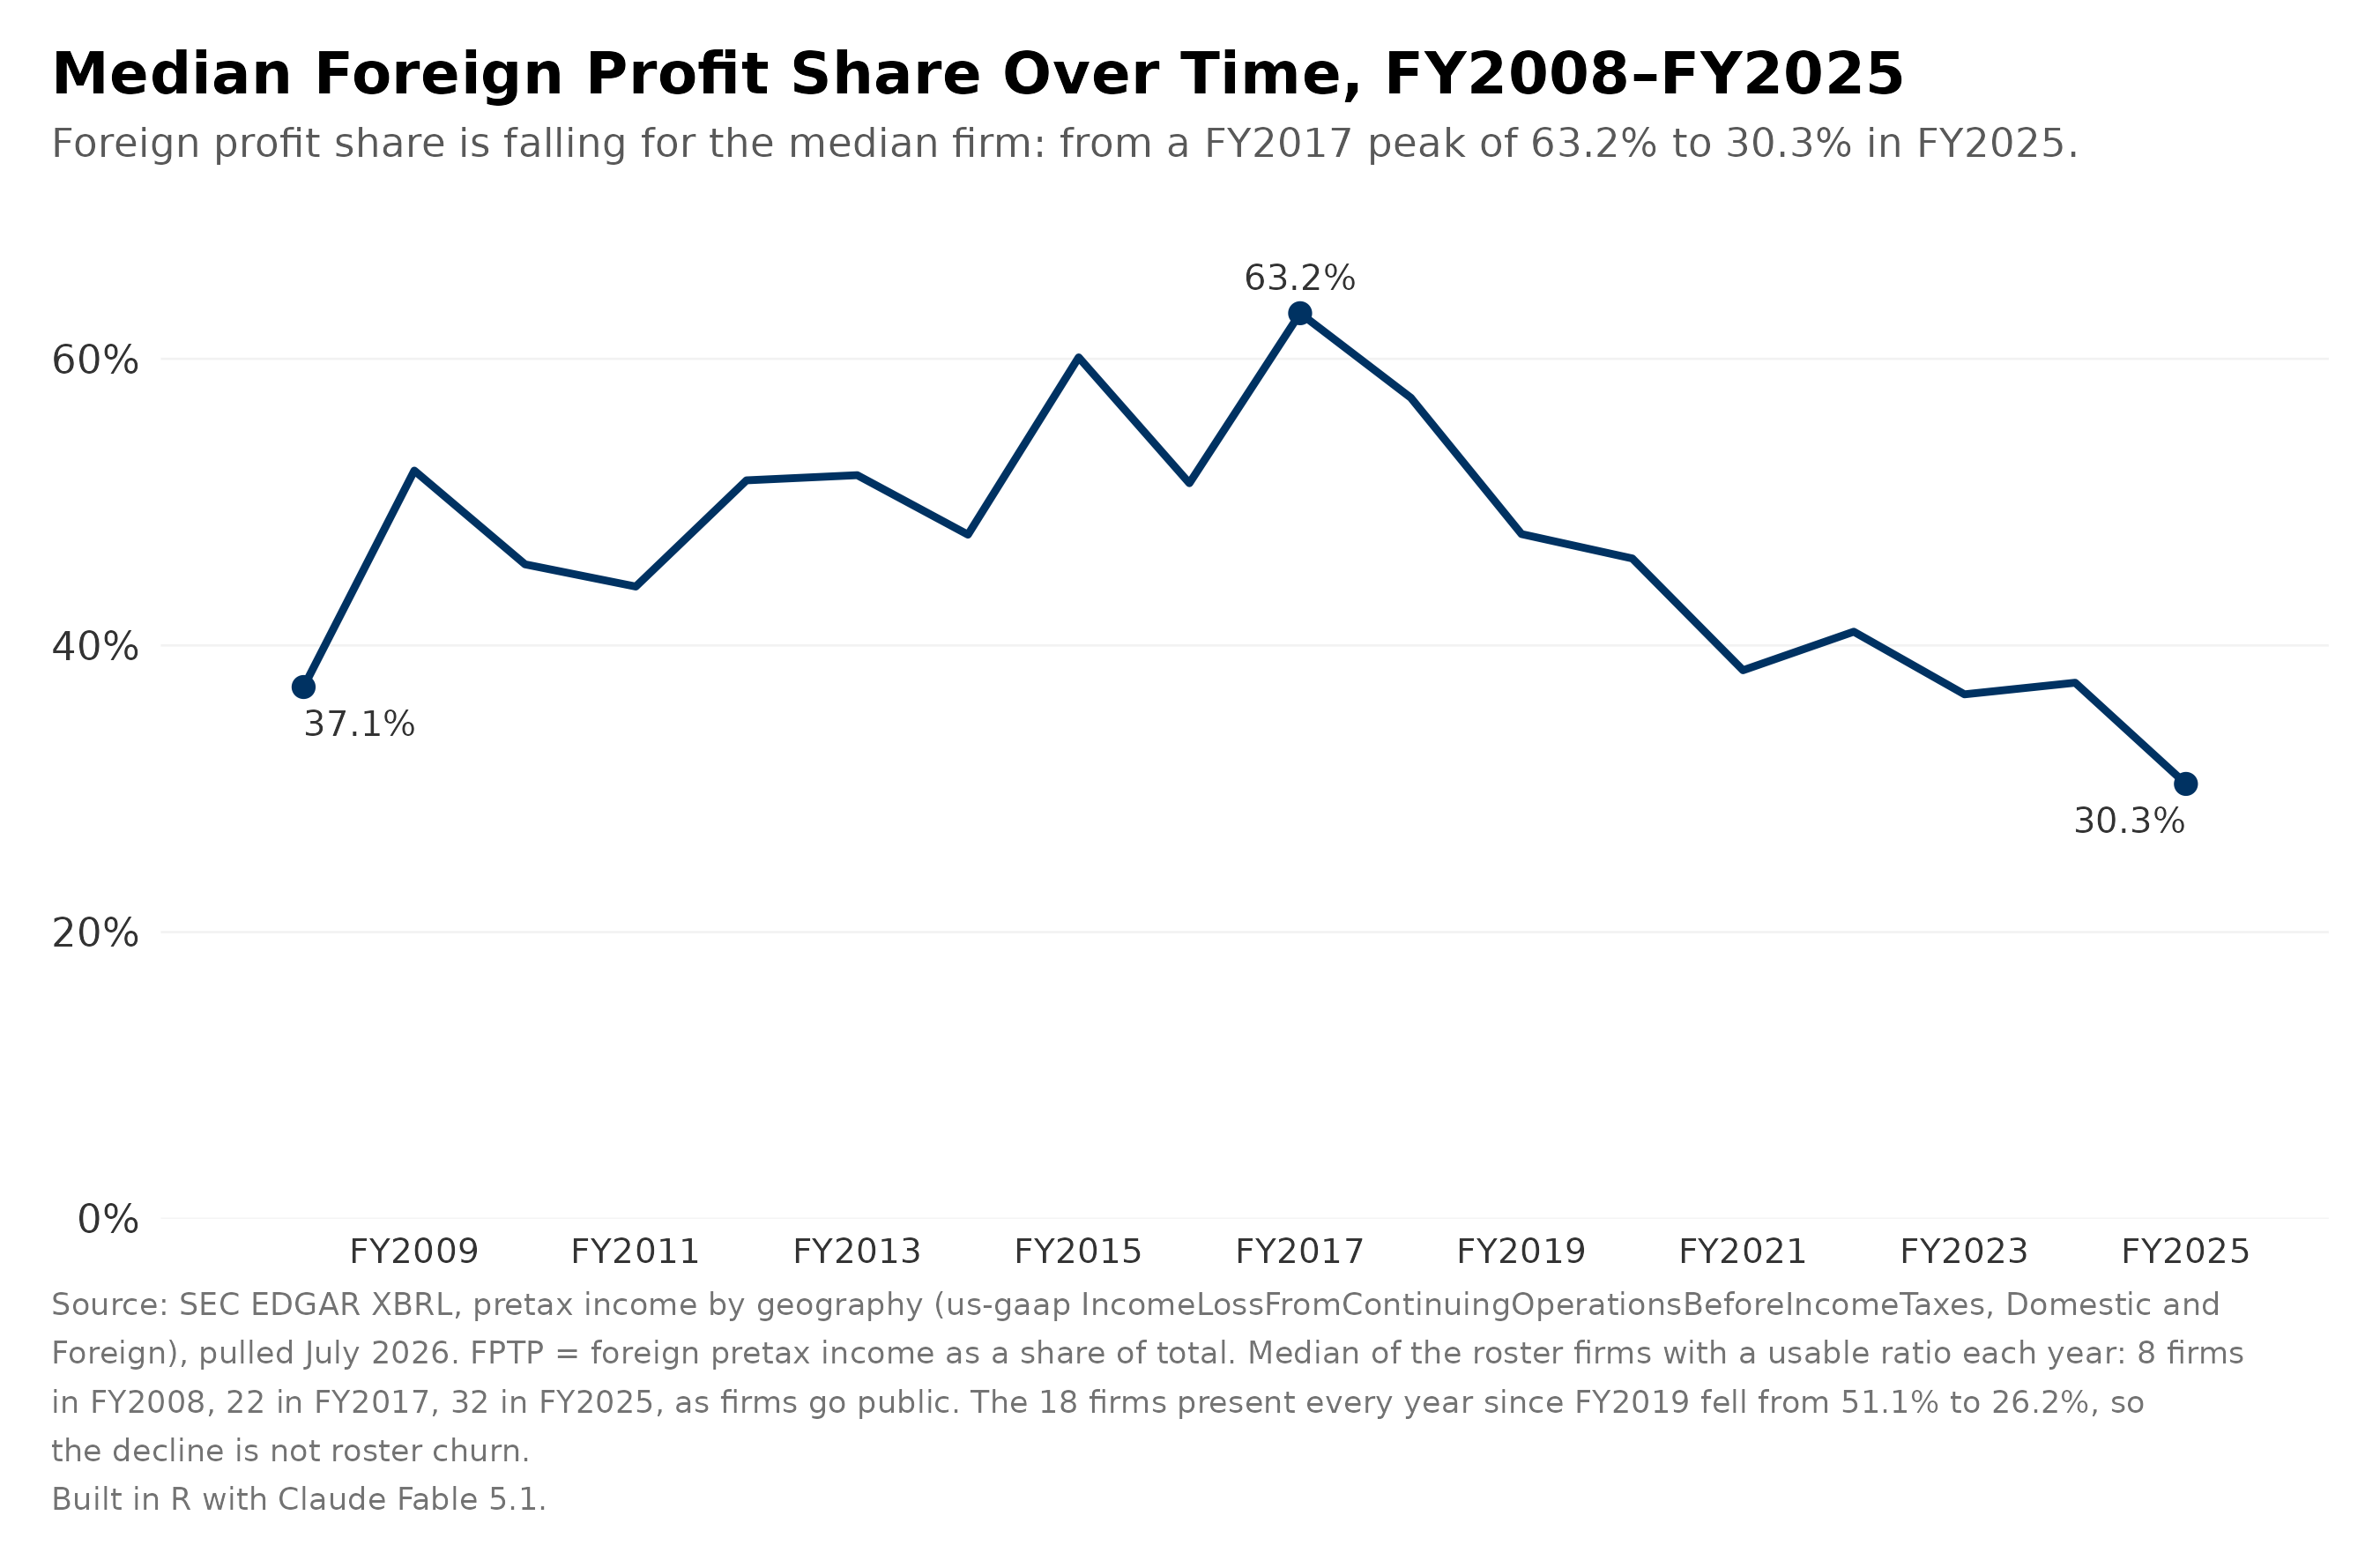
Observing FPTP over time suggests businesses are increasingly earning—or at least reporting—more of their profit in the United States. Even as Bay Area firms have captured a growing share of global profit overall, the share they report earning overseas has fallen: the median foreign profit share roughly halved since its FY2017 peak of 63.2%, falling to 30.3%.
Which companies book more profit abroad? Breaking foreign profit share down by the IT-Layer reveals endpoint device companies report the majority of their profits abroad (59.3%). Analyzing the semiconductor layer requires further discussion into how each company books profits in their 10-Ks. For example, Lam Research reports the highest FPTP of any firm in the dataset, at 95.8%; the company’s own annual report stresses wide-ranging geopolitical risks: “tariffs, export controls, additional taxes, trade barriers, sanctions” and “certain materials … primarily available in a limited number of countries, including rare earth elements, minerals, and metals.”28
Digital platforms report low exposure, at 26.7%, and it’s worth mentioning that figure likely reflects a limitation in the underlying data because of how some digital-born firms can opt to report profits at home. Intuit’s low FPTP is straightforward to explain: its core product, tax software, primarily serves the United States. Meta’s is not: the company reports its own low FPTP in its 10-K,29 especially notable given how extensively Meta’s genuinely global user base has already been documented in this report.
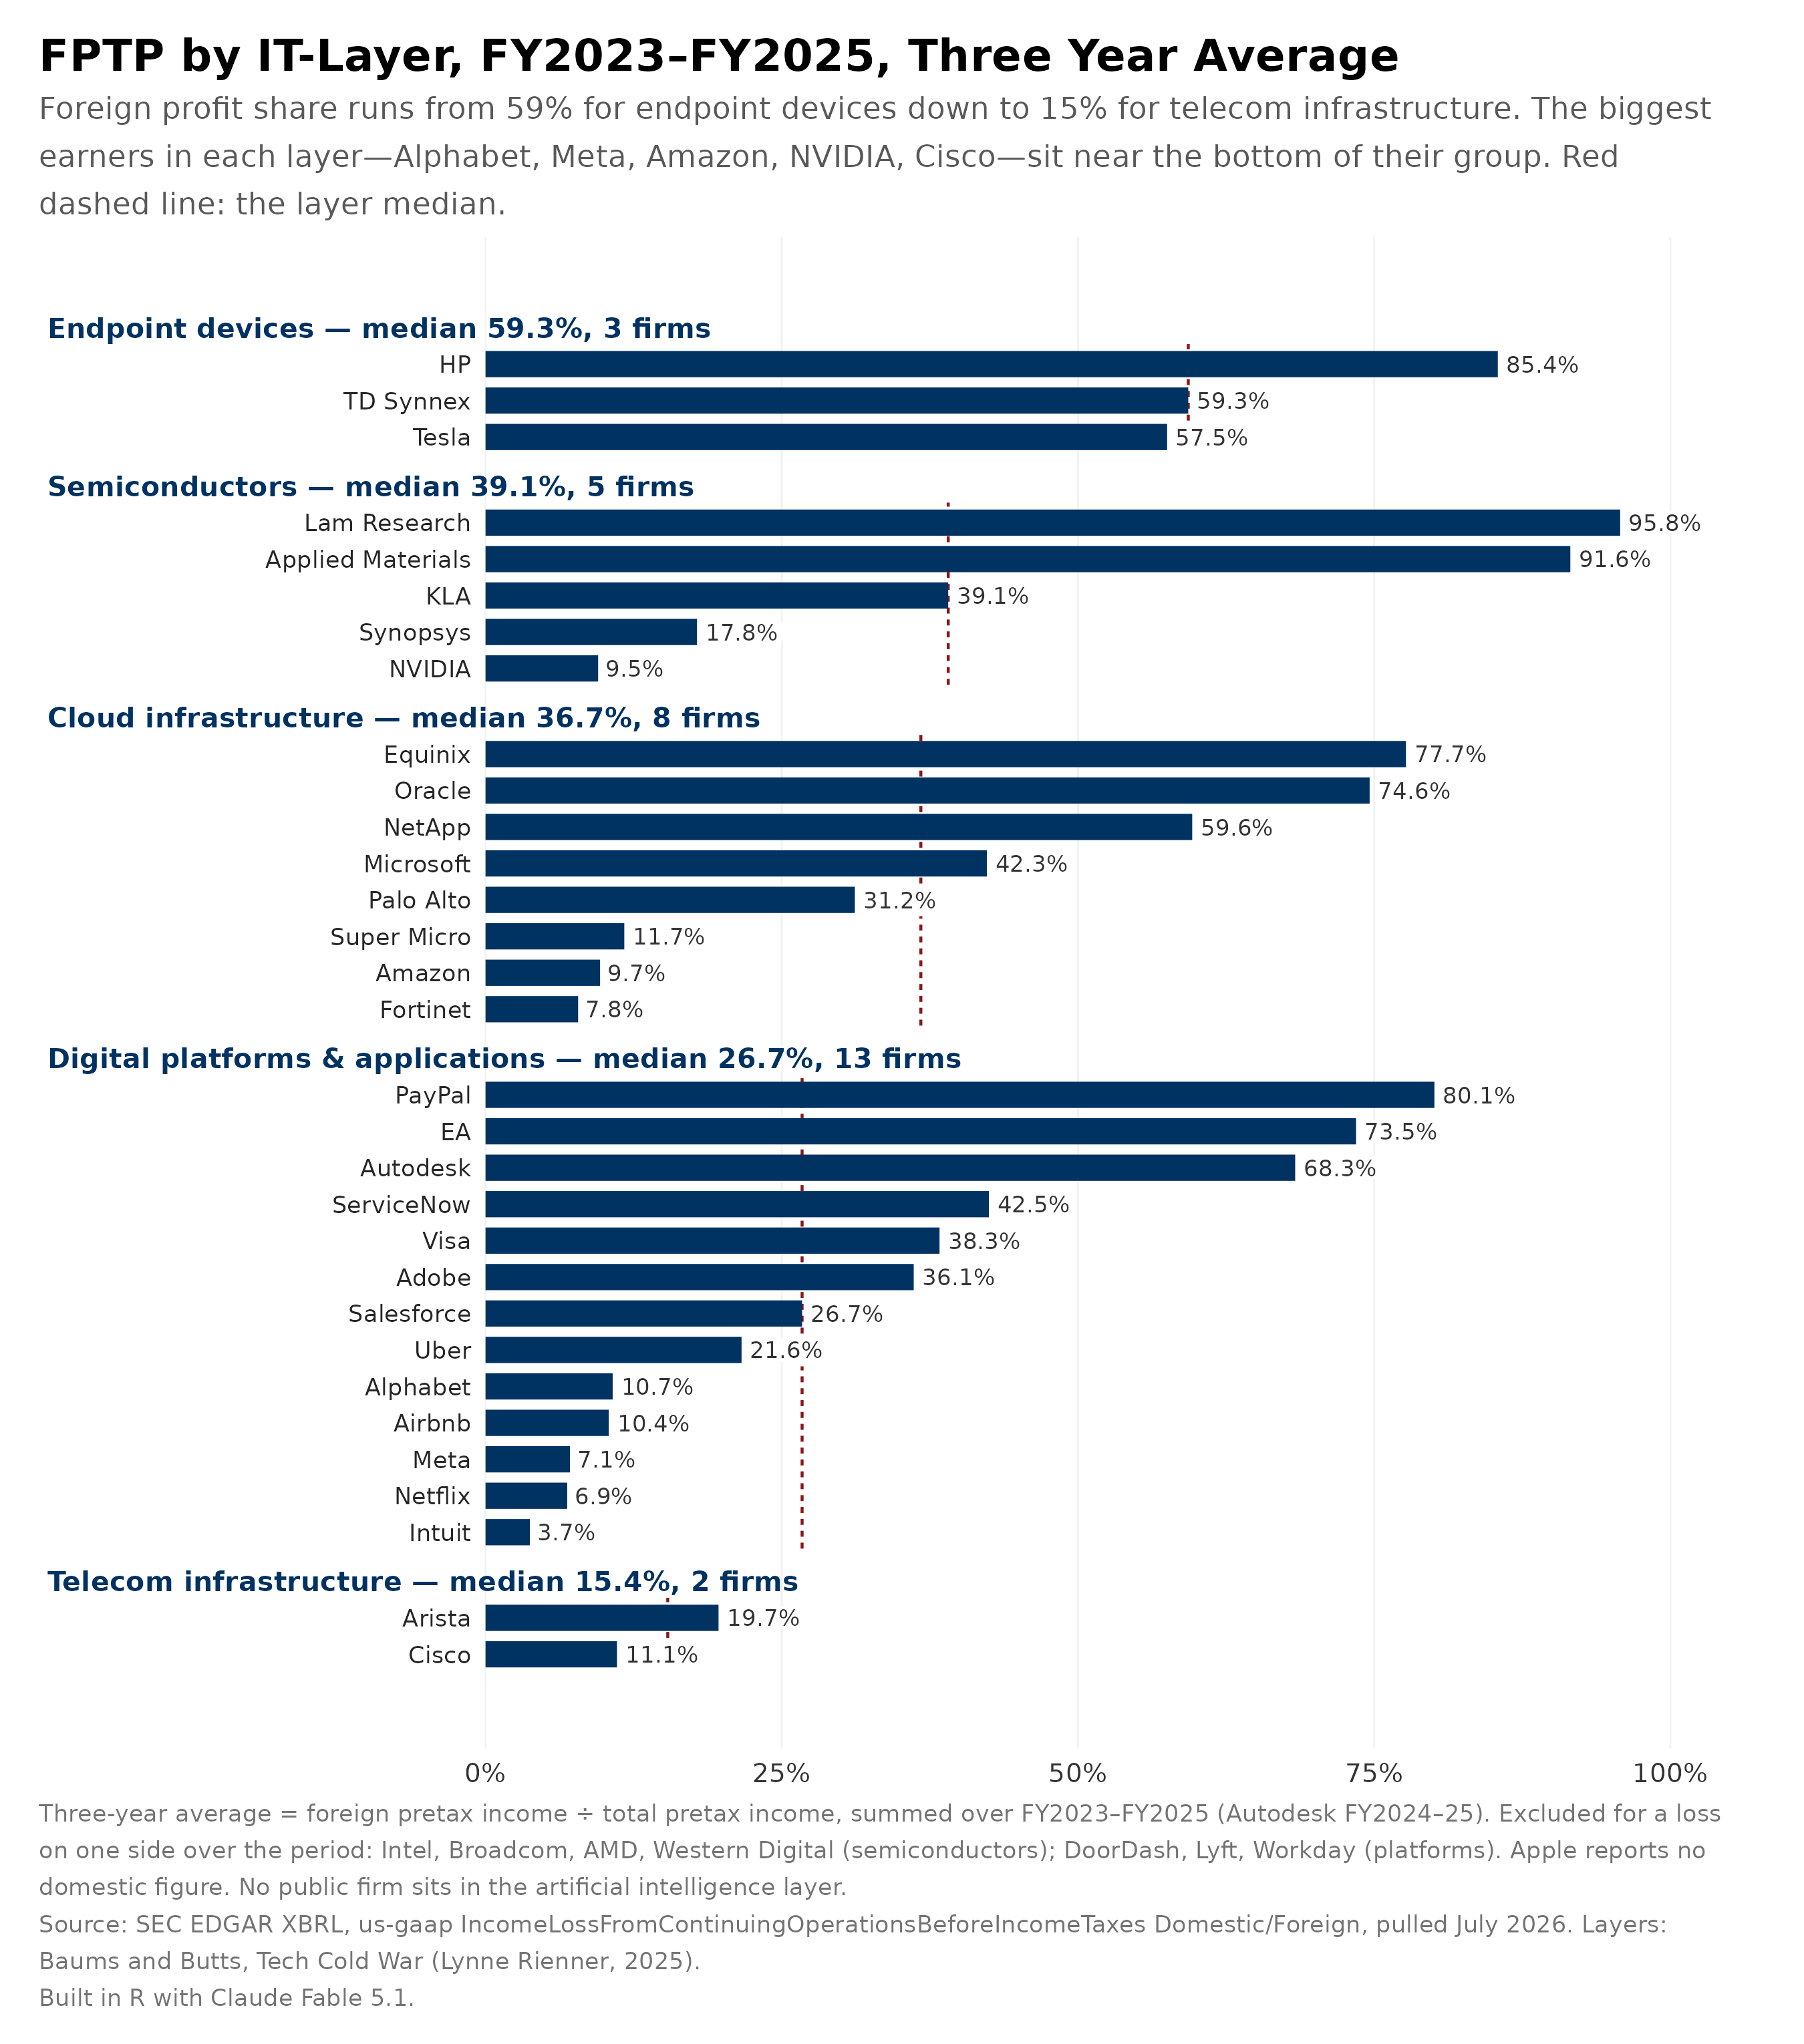
This measure runs into several obstacles worth noting. Seven companies—Intel, Broadcom, AMD, DoorDash, Workday, Lyft, and Western Digital—were excluded from the median calculation because they reported losses in one or both geographies, placing their FPTP outside the interpretable 0-100% range.30 Breaking the analysis down by company also exposes a deeper issue: transfer pricing. Firms book profit in ways that optimize for tax treatment, which may not align with where their actual business or users are located.31 By three-year average FPTP (FY2023–2025), the most foreign-oriented Bay Area-headquartered firms in the list are Lam Research (95.8%), Applied Materials (91.6%), and HP (85.4%); the most domestic-slanted firms are Intuit (3.7%), Netflix (6.9%), and Meta Platforms (7.1%).
Observing foreign profit share can paint a mixed picture of fragmentation. The trend that foreign profit share is down by half—the median firm earned 63.2% overseas in FY2017 versus 30.3% in FY2025—suggests business came home. Peaking in FY2017, the fall afterwards deserves some attribution to new incentives that reward companies for reporting in the United States the foreign sales of U.S.-held intellectual property, including the profit earned overseas.32 Most exposed are those firms unable to bring profits home: Lam Research, Applied Materials, and HP make equipment that could be owned by legal entities abroad with US parents. For the profits that do return home, they help fuel the Bay Area innovation engine, allowing these incumbents to deploy more capital towards researching, developing, and investing in successive waves of technology.
Digital Demand Is Not Fragmenting
For technology companies that sell physical products and infrastructure, financial reporting reflects a real operational and physical footprint overseas—profit earned abroad reflects genuine activity and exposure there. But as Meta’s case shows, a 6.1% FPTP in FY2024 suggests a category of companies escapes these traditional metrics by being “born-digital”: digital multinational enterprises that achieve rapid international growth through digital business models rather than physical expansion.33
“Born-digital” firms reach markets worldwide just like their physical counterparts, but their digital nature lets them scale rapidly, carry fewer physical assets on their books, and often report revenue in locations that don’t match where their customers actually are.34 This discrepancy invites the need for another metric to survey commercial exposure to geopolitics.
This section offers Google Trends as a novel research source to measure transnationality differently from firm-reported accounting data like profit. Google Trends captures search volume for key terms related to Bay Area technology companies, serving as a proxy for demand. This works because of Google’s dominance in global search: as of June 2026, Google held a 91.27% share of worldwide search, making its data a reasonable proxy for the digital behavior of billions of individual users.3536
Harald Puhr, the study’s lead author, and his co-authors Müllner and Trentini (2023) use Google Trends to construct a “Degree of Internationalization” (DOI) score, which measures how evenly search interest in a firm’s product is distributed across countries.37 DOI is scaled from 0 to 1: a score of 0 means search interest is concentrated in a single country, while a score of 1 means interest is spread across all countries measured.38 Where FPTP captures how a company books profit overseas versus at home, DOI captures how its user demand is distributed across borders.
If digital demand for Bay Area technology were to be fragmenting, DOI would fall because it would reflect search interest concentrating into the US market or another allied market. A higher DOI can suggest a lack of fragmenting digital demand.
Meta is the clearest illustration of why this second lens matters. The company reports an FPTP of just 6.1% in FY2024—by that measure alone, one of the most domestically anchored firms in this entire dataset. But by creating a basket DOI of its three consumer apps—taking the terms Instagram, Facebook and WhatsApp—the resulting figure is 0.707, suggesting a widely distributed digital demand.39 In June 2026, Meta’s family of apps averaged 3.60 billion daily active people worldwide—a genuinely global footprint that the FPTP figure alone would never reveal. The gap between these two numbers, for the same company, is the entire point of adding Google Trends to this analysis: a firm’s commercial exposure to the world can be far larger than its accounting statements suggest, particularly for firms that monetize global attention rather than global assembly lines. Further discussion between DOI and FPTP will follow in the concluding chapter that offers cross-metric comparisons.
Extending Puhr, Müllner, and Trentini’s methodology to Bay Area technology companies requires further scrutiny of the roster: only 15 firms have been selected of all 47 possible firms due to their consumer-facing, digital-born nature, as defined by Claudia Trentini and her UNCTAD co-authors.40 As Puhr, Müllner, and Trentini note, “Ideally, researchers also include an additional control for B2B versus B2C to capture systematic biases.”41
To draw conclusions about digital fragmentation with DOI and Google Trends, this section shrinks the list to measure a basket of terms under flagship consumer brands.42 Two limits must be noted. China blocks Google and other digital firms. Instances of digital decoupling in the observed periods are missing. And three artificial intelligence labs—OpenAI, Anthropic, and xAI—launched their products inside the window. Their significant rise in DOI reflects the worldwide spread in their product; that does not reflect a change in established demand.
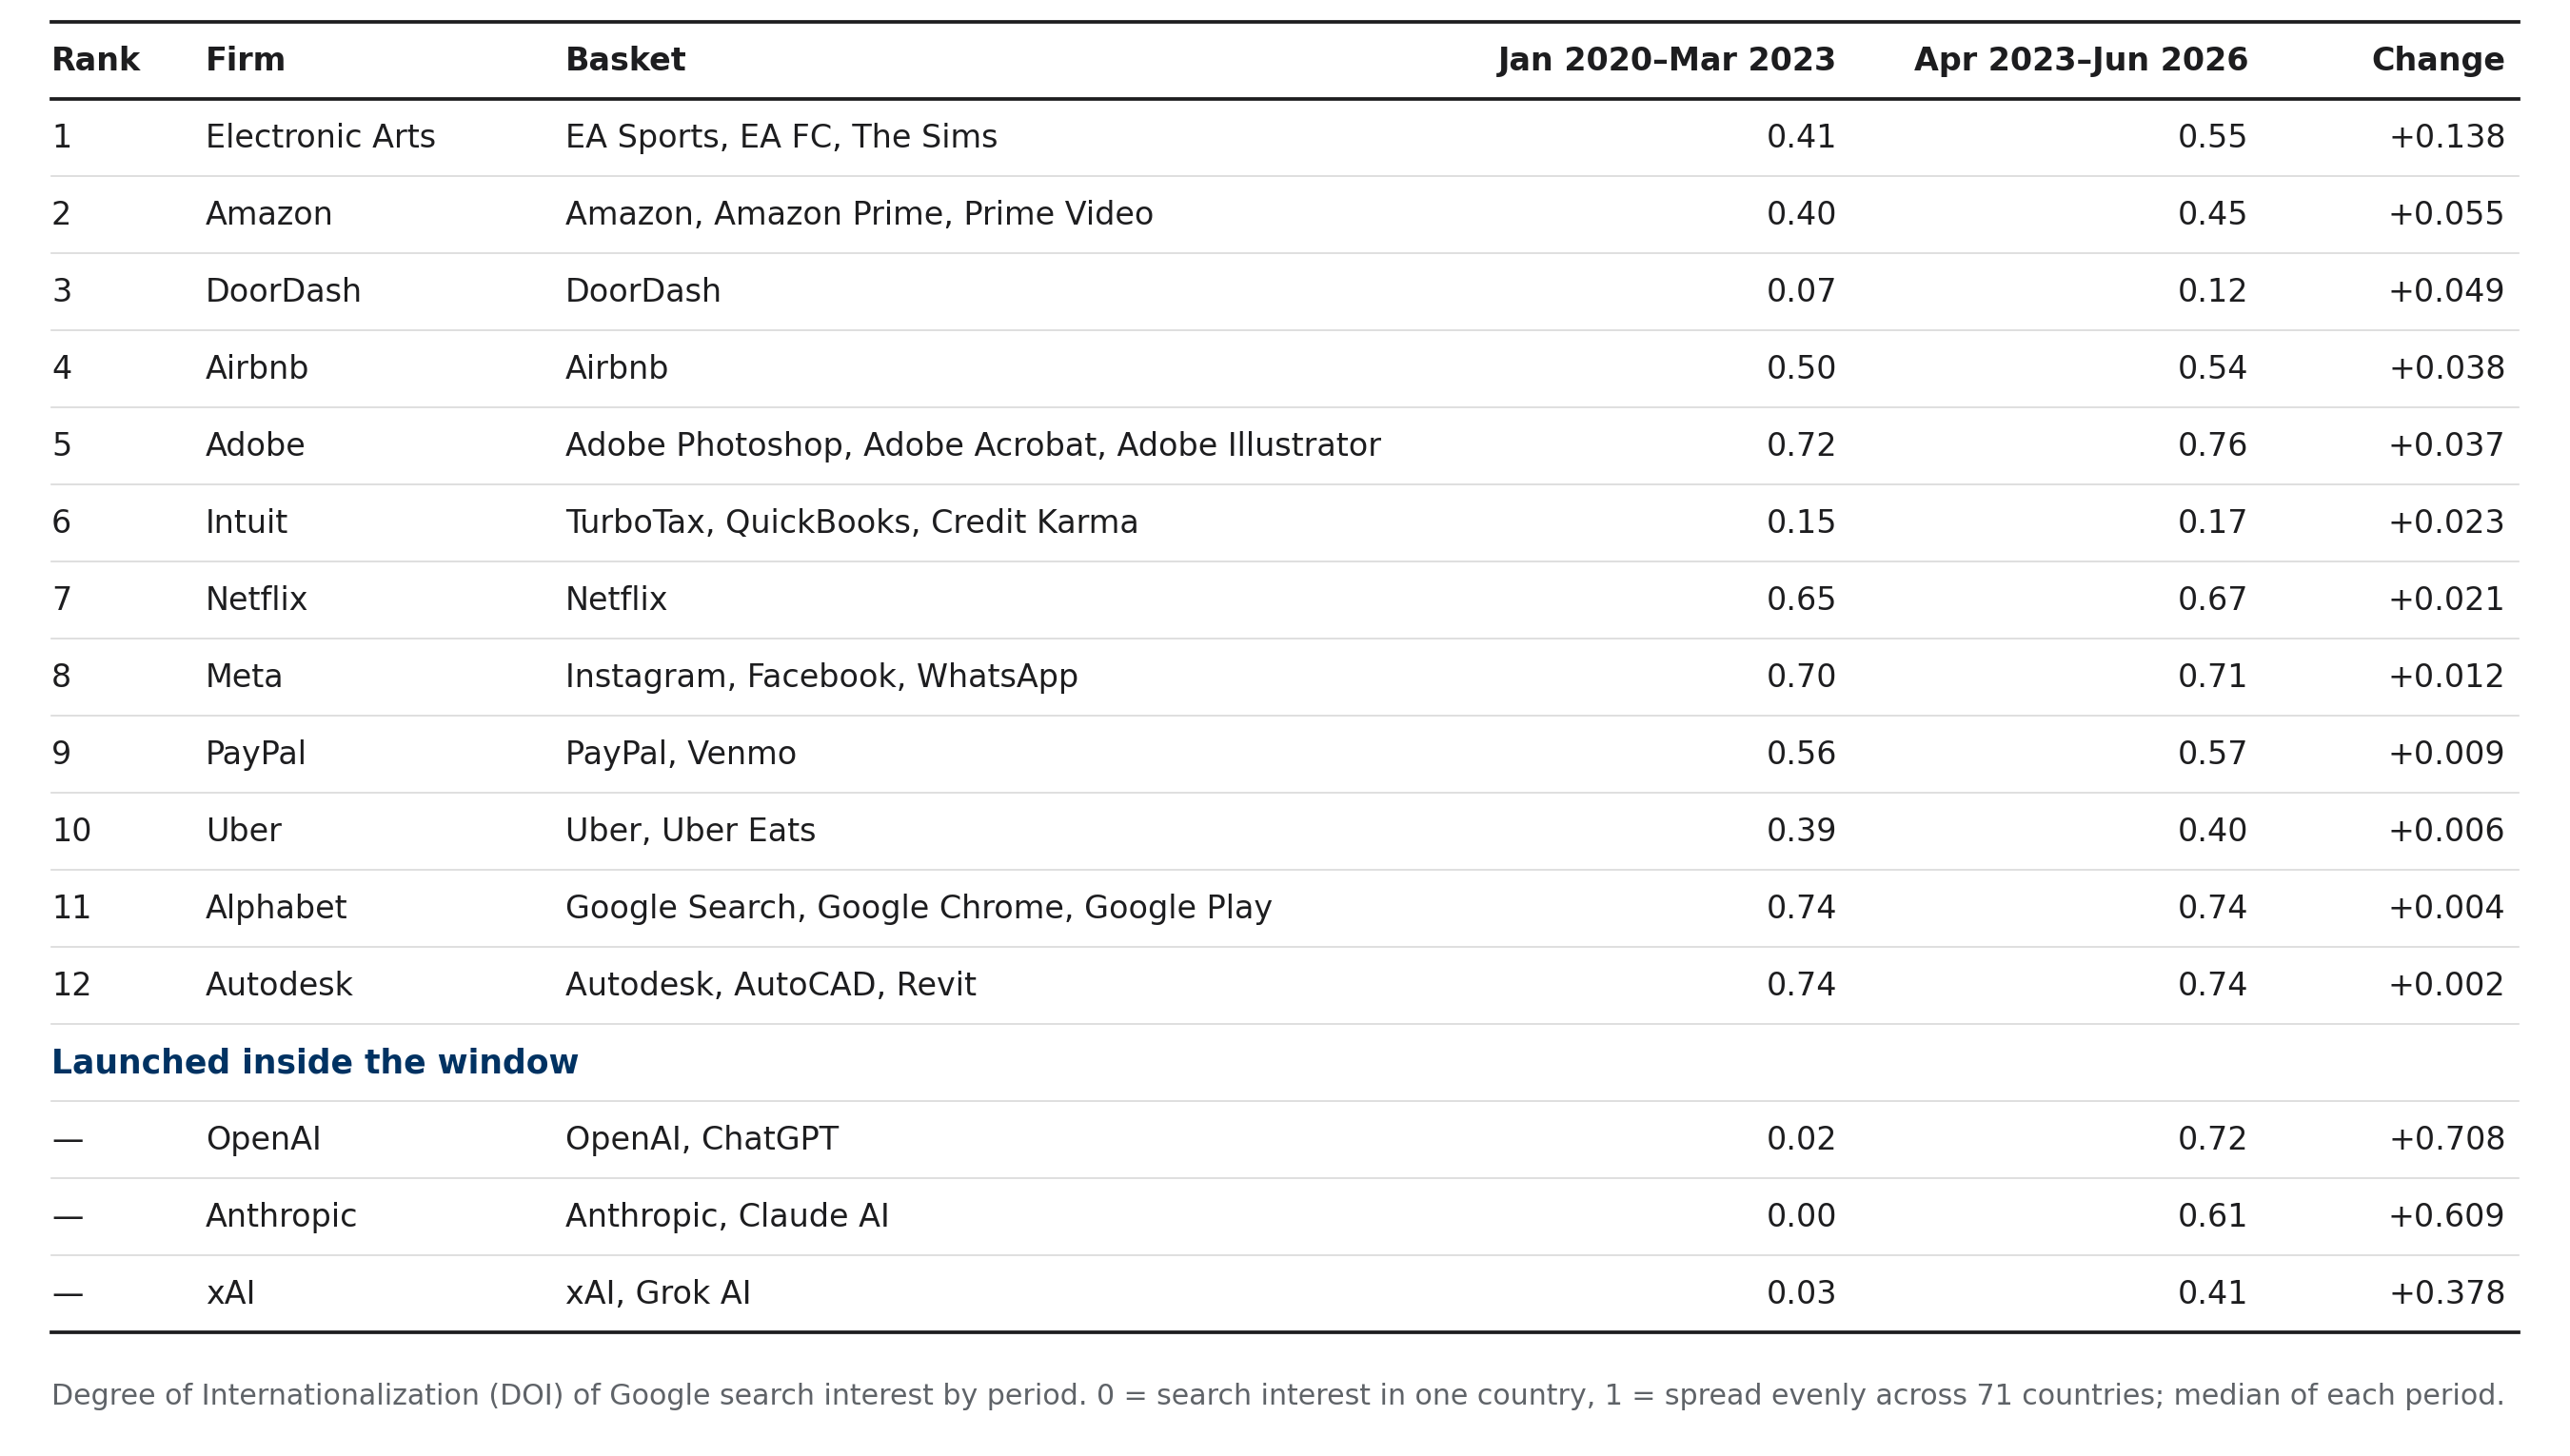
The analysis suggests that digital firms managed to relatively diffuse their products across borders more, or maintain their spread. DOI does not speak to absolute growth. Outside the newly launched products, none of the 12 established firms became more concentrated. Search usage remained widely distributed. In fact, the US share of search interest fell for all 12 established companies, suggesting companies saw an increase in overseas search demand.
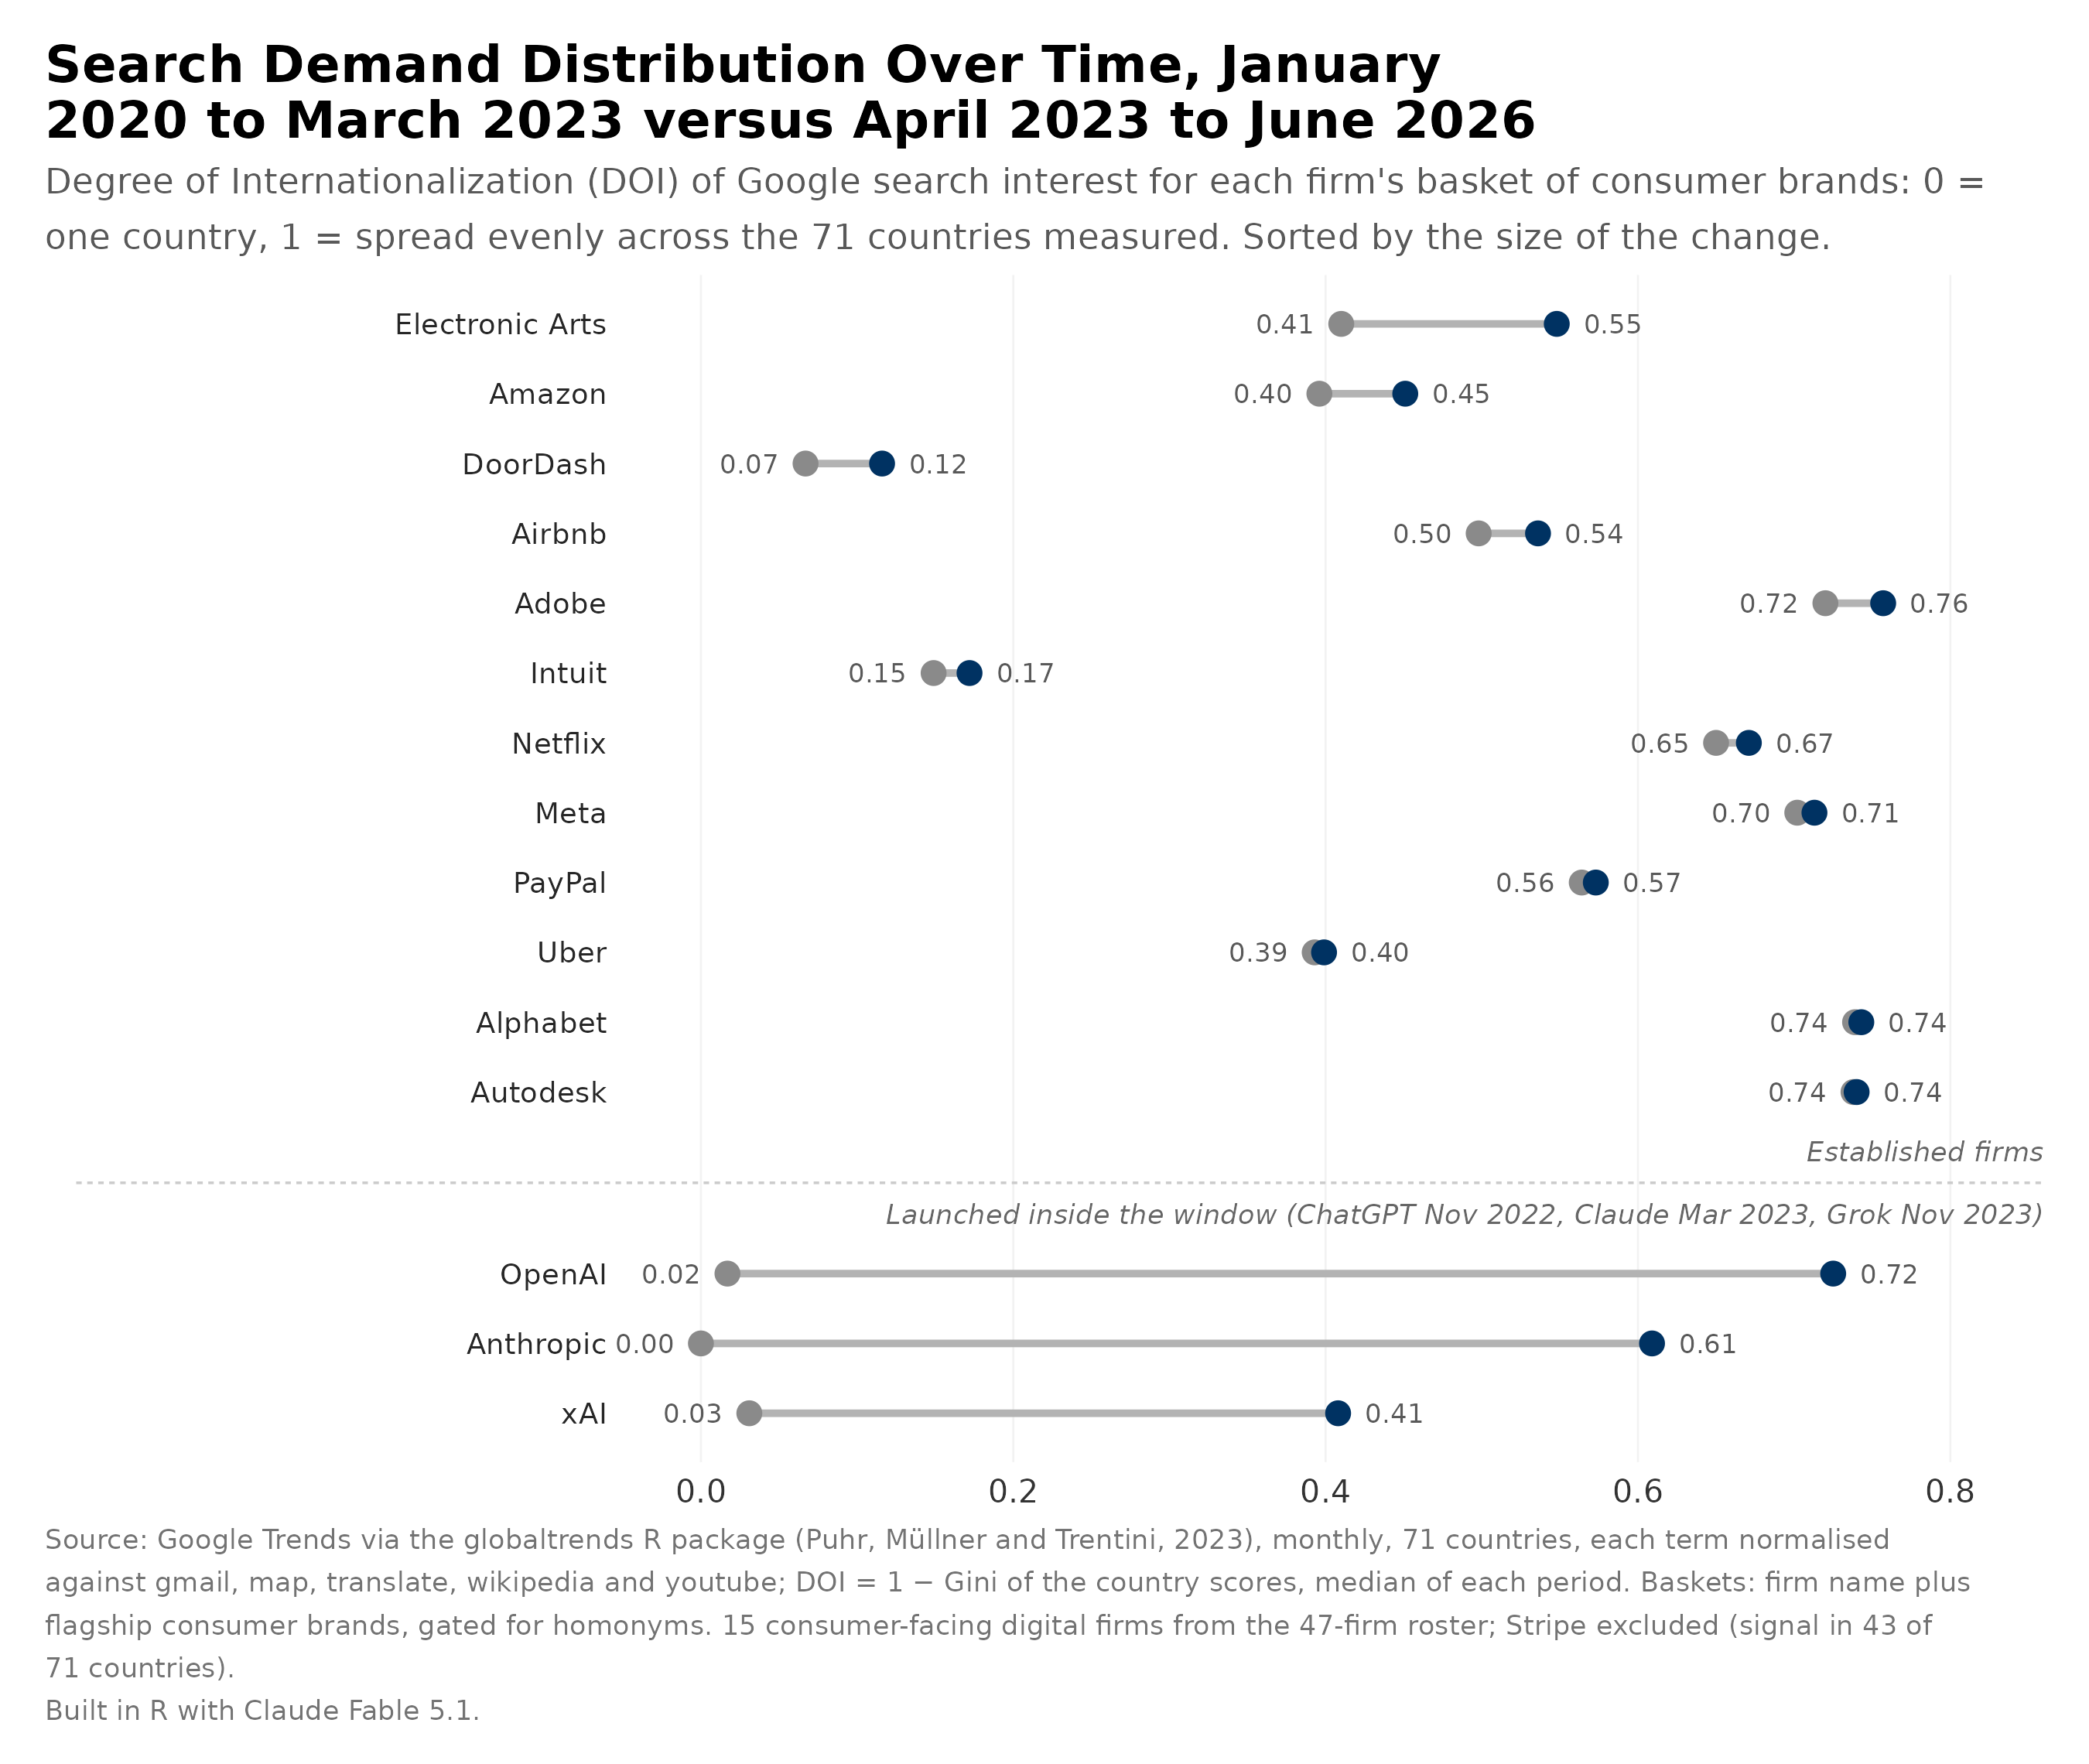
Extending Puhr, Müllner, and Trentini’s methodology to Bay Area technology companies in this way reveals which firms are more thinly spread across the world than traditional profit-based metrics alone would suggest—a gap in exposure that matters precisely because it is invisible to the accounting-based measures policymakers and analysts typically rely on.
Hedging New Future Projects
History shows that Bay Area technology companies have long earned money in markets around the world. This section asks whether they are still investing in building out that presence today via a metric called “foreign direct investment” (FDI). As Matt Sheehan writes in The Transpacific Experiment, “FDI refers to a foreign company either acquiring a large stake in a U.S. firm or setting up its own operation on American soil.” Bay Area technology “greenfield” projects are the latter where the firms in the roster announce a new project on foreign soil.43
This section examines newly announced overseas greenfields tracked from January 2010 to May 2026 by the Financial Times’ fDi Markets database, which aggregates data from media, newswires, and investment-agency sources.44
This analysis relies upon a dataset limited to headquartered California firms. This excludes Amazon and Microsoft. Due to limitations in the dataset, their outbound FDI data falls outside the scope of this report; though both are headquartered in Washington State, the rest of the report incorporates them as part of the broader Bay Area cluster thanks to their major operational presence. Conclusions thus trend towards the lower bound as both companies invest heavily worldwide.
If fragmenting were to be occurring, announced projects would be shoring away from rival-bloc destinations and toward allied markets.
Why do companies invest overseas? Drawing on background interviews with leading firms and experts, this report proposes three motivations: revenue (e.g. setting up sales and marketing offices), resources (e.g. R&D and manufacturing), and infrastructure (e.g. broadband, data centers, disaster recovery, and wireless communications projects).
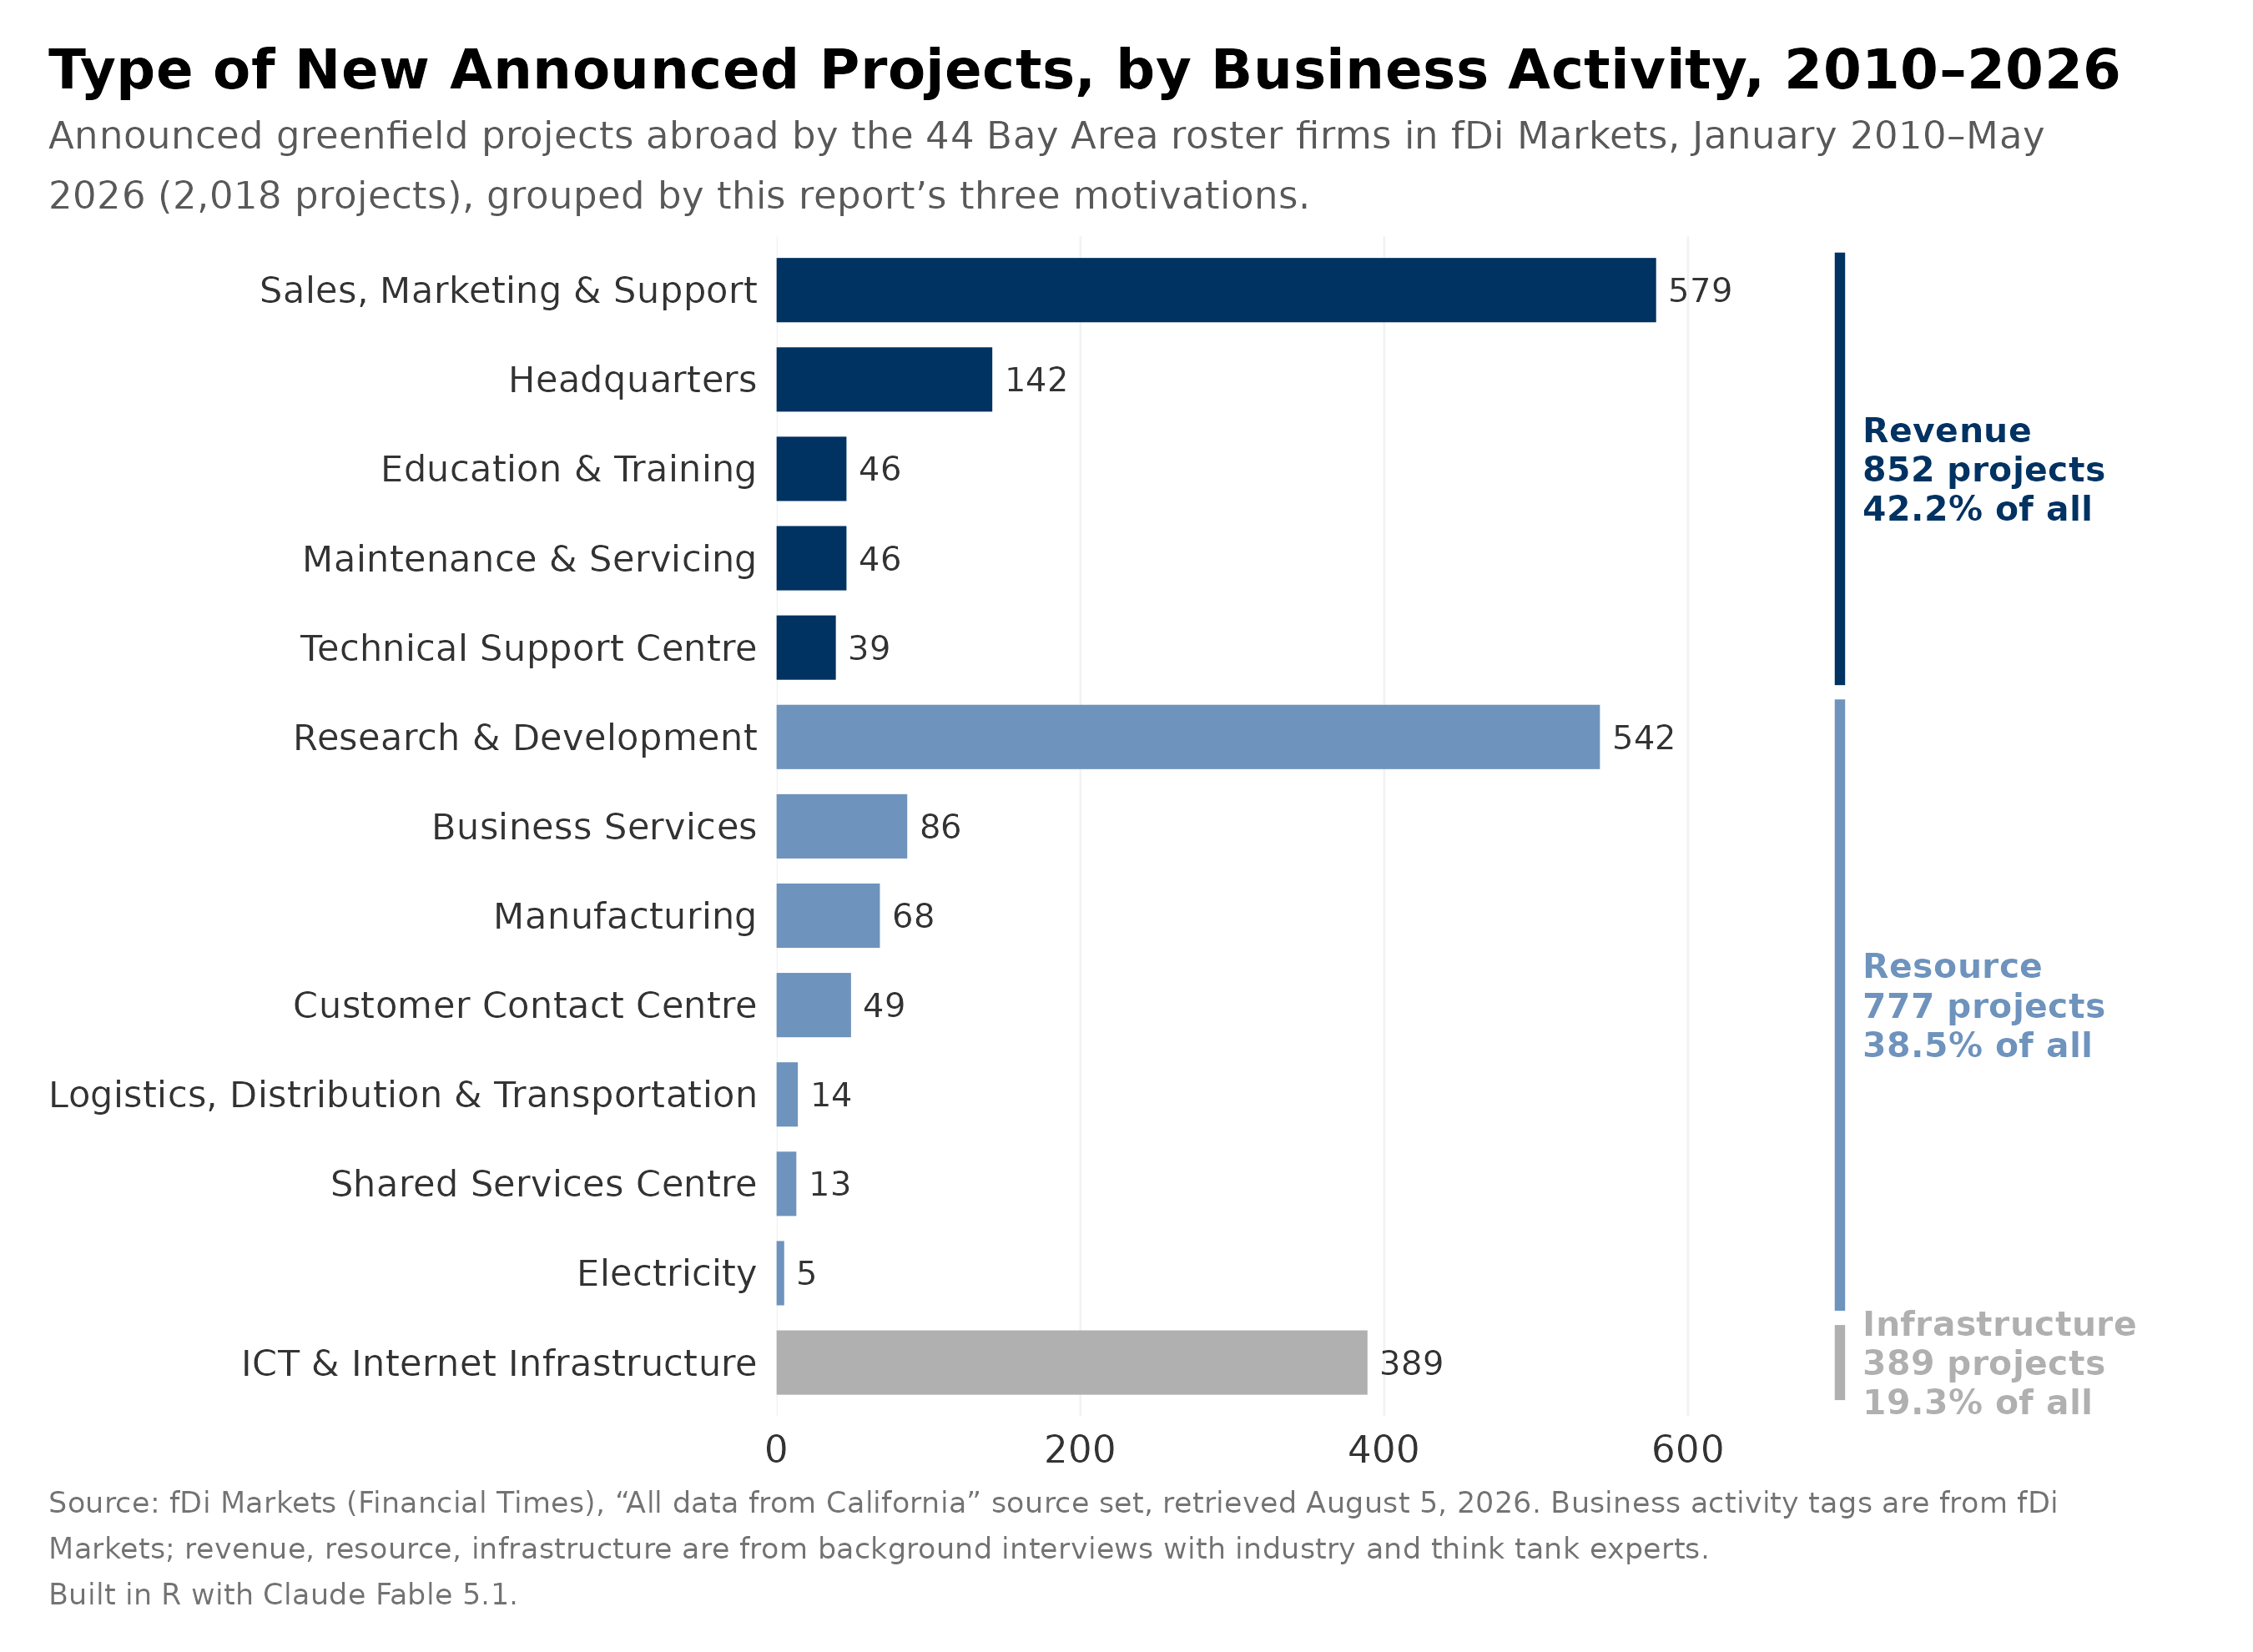
Mapping these motivations onto business activities reveals how companies pursue each goal. From January 2010 to May 2026, of 2,018 total announced projects, revenue and resource motivations were roughly evenly split (42.2% and 38.5%, respectively), with infrastructure trailing at 19.3%. 45
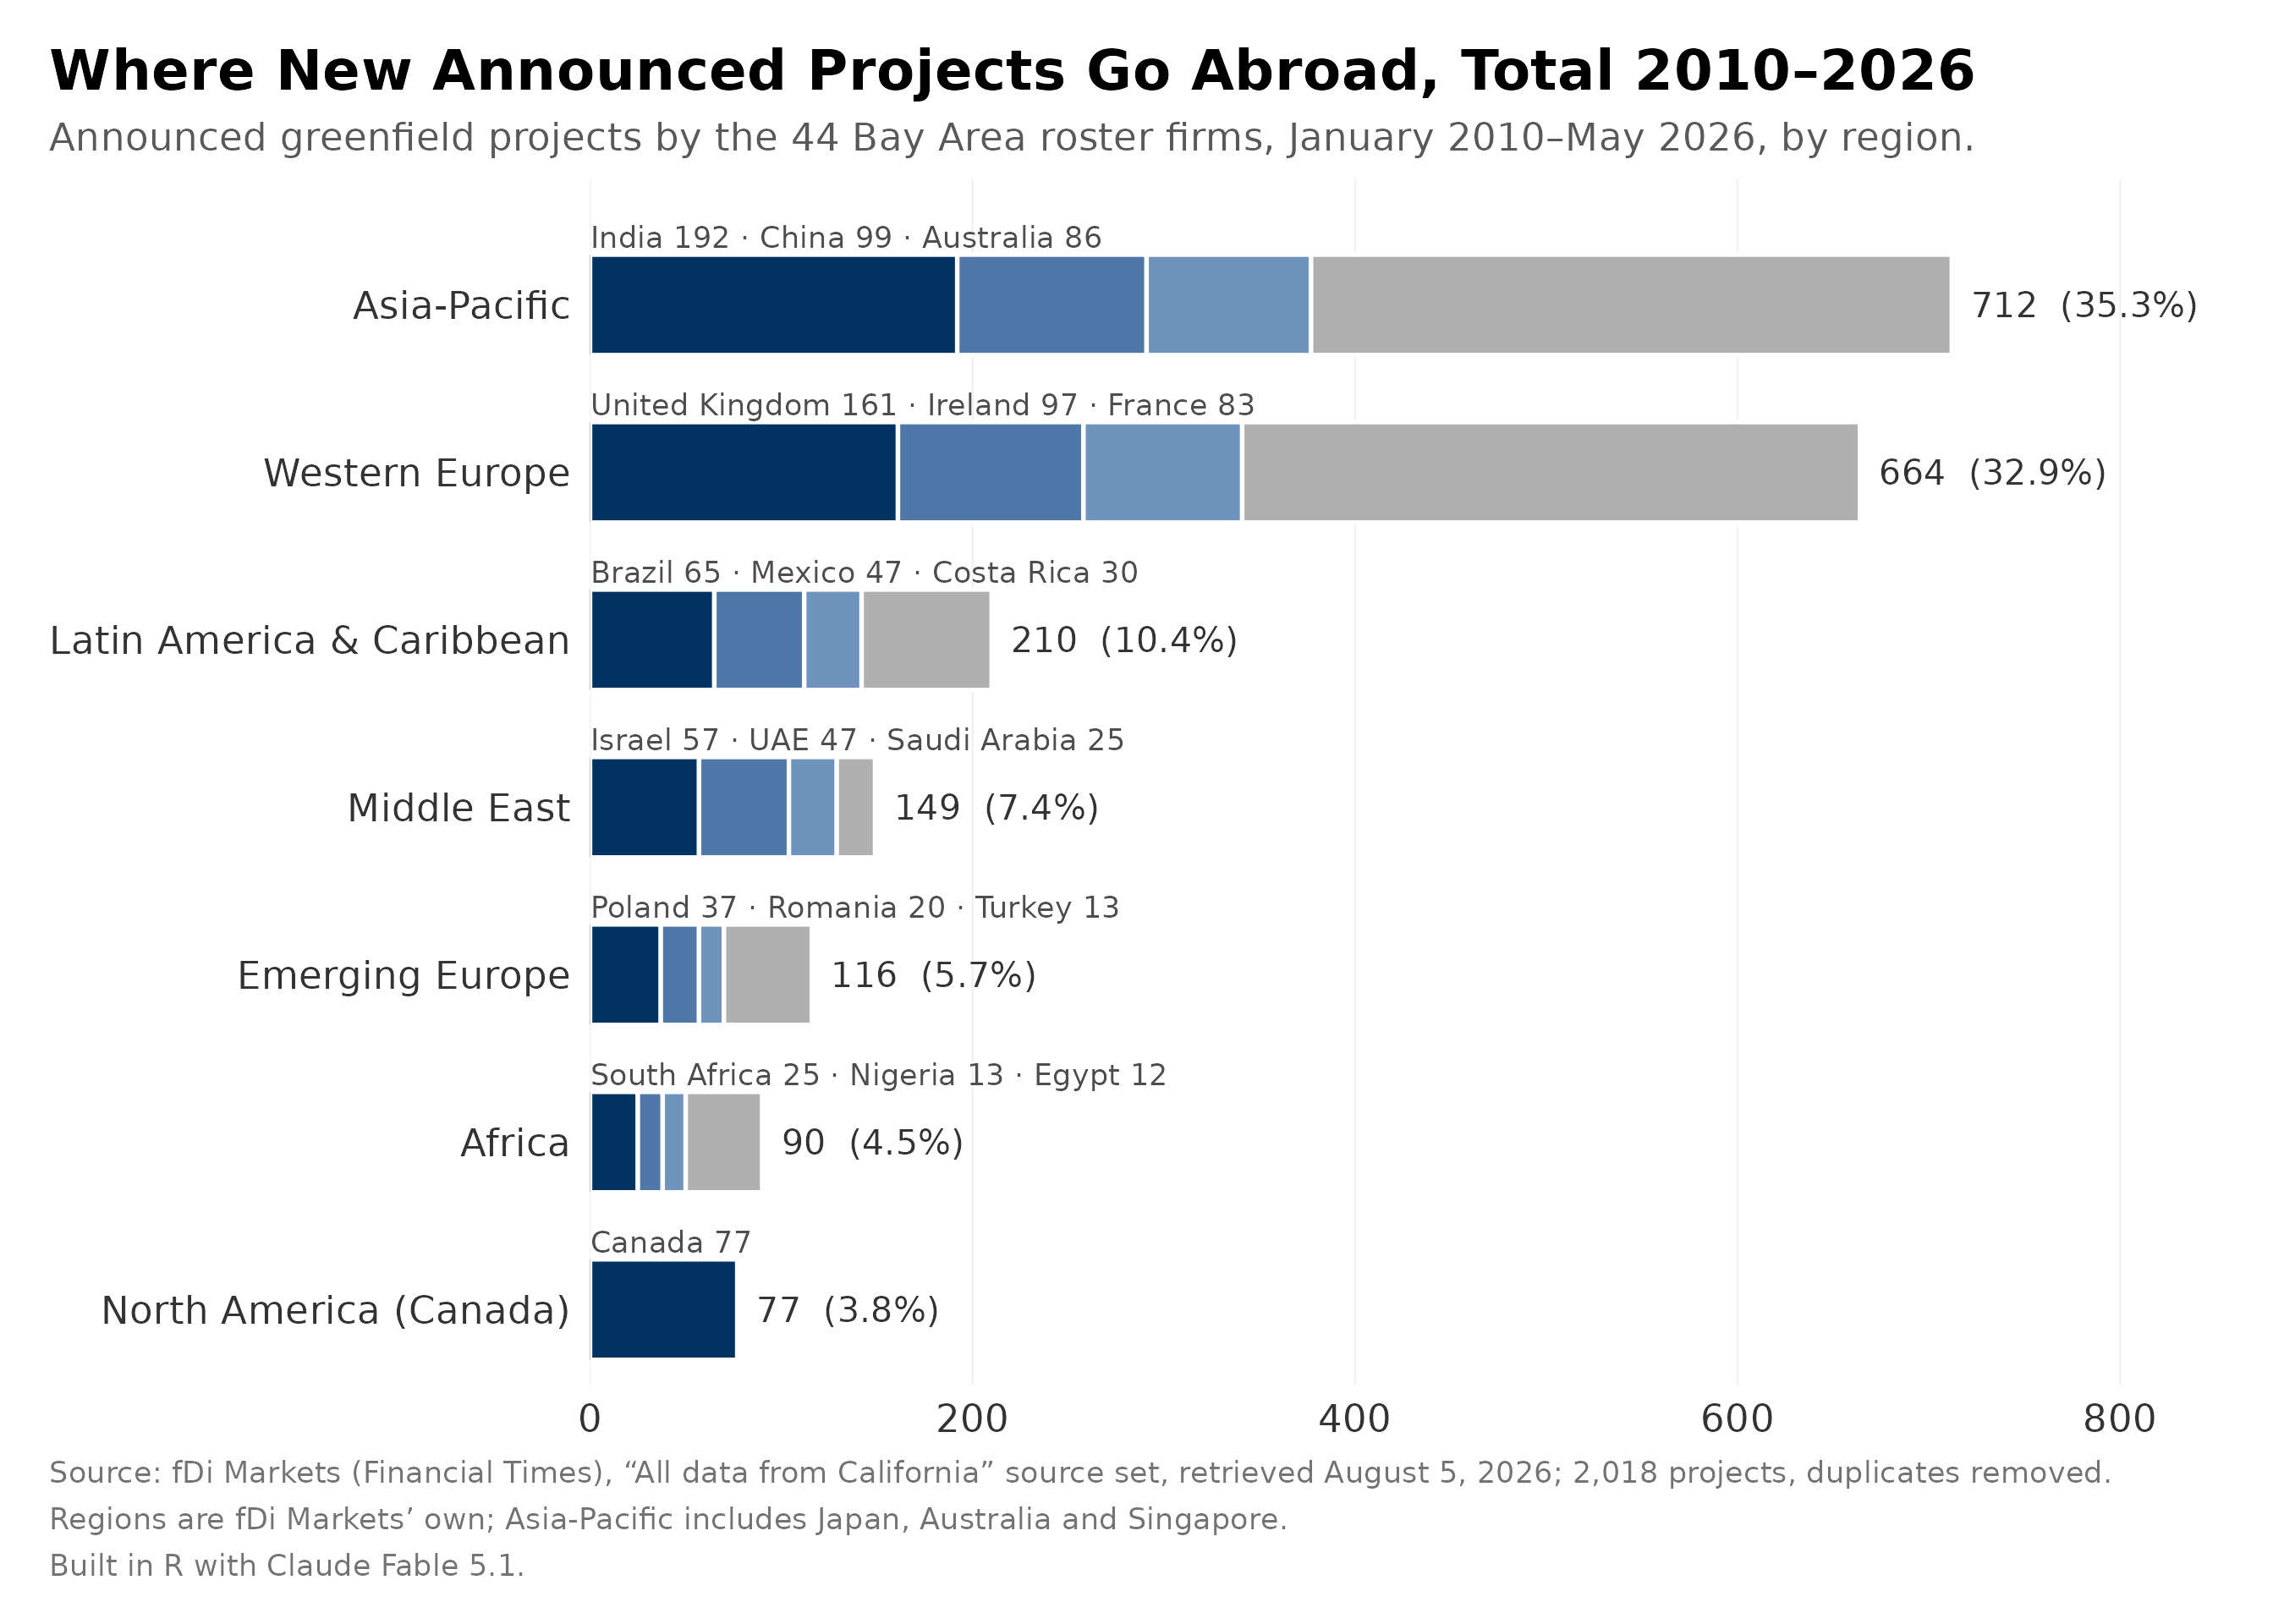
Where do these projects go? Looking back across the full dataset since 2010, the Asia-Pacific region leads with 712 projects (35.3%), followed closely by Western Europe with 664 (32.9%), and, farther behind, Latin America and the Caribbean with 210 (10.4%). Europe (including both Western and emerging markets) and Asia-Pacific together account for 74% of all projects.
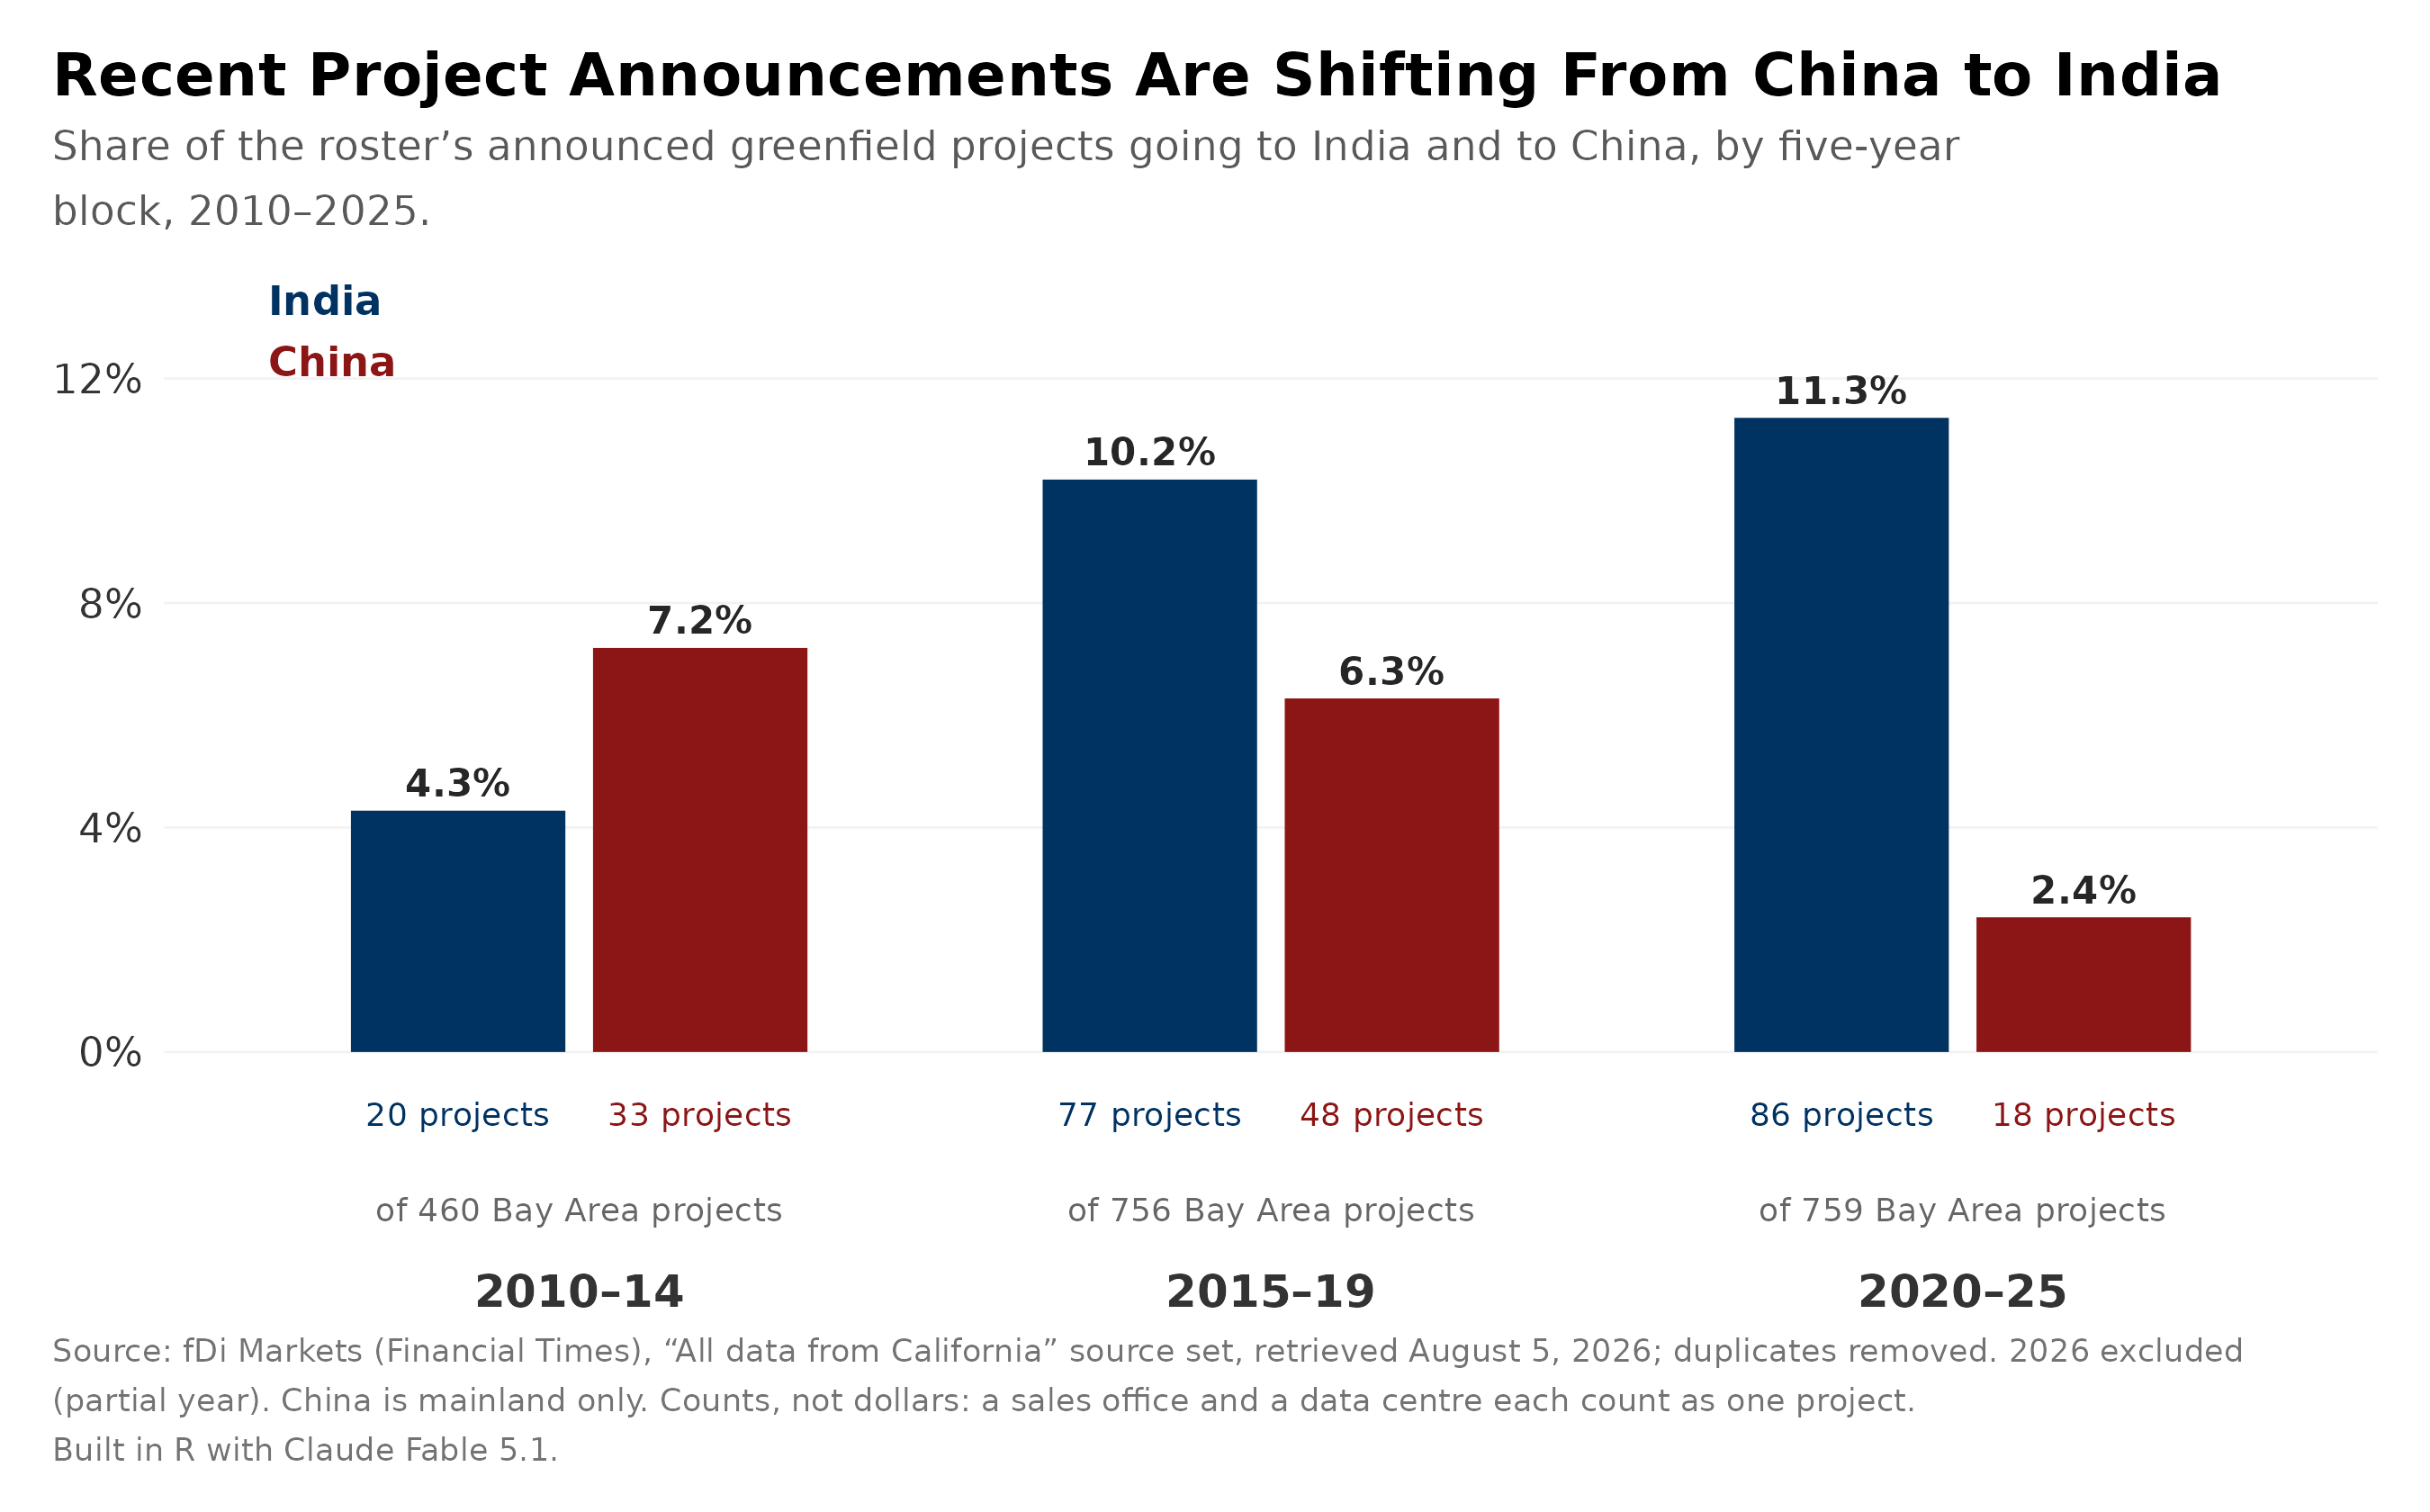
At the country level, China’s share of new projects is declining, from 7.2% in 2010–14 to 2.4% in 2020–25. India is rising, from 4.3% to 11.3%. Since 2020, the dataset indicates no new infrastructure project has been announced in China. China requires that this type of infrastructure project be capped at 50% foreign shareholder ownership, so foreign firms like AWS and Apple run data centers through Chinese partners.46 In addition, a data center built with majority Chinese ownership may be recorded under the partner’s name, not the Bay Area firm. This falls in line with its larger Great Firewall strategy intended to retain technological sovereignty. Out of all projects since 2020, the shift is small but worth noting in how firms are responding by moving new projects away from a rival market and toward an allied one.
As with other sections, the greenfield data carries limitations. Counting projects captures frequency but not magnitude—the dataset does not consistently report the size of each investment. Of 2,018 total projects announced, 583 (28.9%) projects carry either jobs or capital invested, 1,435 (71.1%) carry neither, and only 83 (4.1%) carry both. As a result, project counts are used throughout this analysis on the understanding that a modest “Sales, Marketing & Support” office is counted identically to a major infrastructure project like a data center.
Tracking new greenfield announcements suggests Bay Area tech firms are hedging. Outbound FDI efforts remain strong, only slightly re-routing away from China and towards India. Western Europe held relatively constant throughout. In absolute terms, the cumulative footprint abroad keeps growing amidst a minor hedge. However, this dataset only tracks announcements of new projects; making conclusions about future fragmentation based on it is limited because it does not accurately cover how many are completed, the jobs they create, or the money invested.
Wow, you are special. Last to come will be a concluding chapter, synthesizing conclusions from the numbers today (Volume II) and historical stories told thus far (Volume I).
Thank you,
Max
AI Disclaimer: Claude serves as my research assistant with a strict ~20 rule markdown that I continue to iterate on where I think it reduces the friction of research, without ceding cognitive sovereignty over my ability to form original thoughts and learn. It built and ran data pipelines → rendered charts → verified sources → and formatted citations. | The line is drawn at arguments and prose. Where Claude writes a note, it says so. I am not perfect and will continue to improve. I want the stakes to be higher. |
Joint Venture Silicon Valley, Institute for Regional Studies, 2025 Silicon Valley Index (San Jose, 2025), 8.
Proclamation 10973, “Restriction on Entry of Certain Nonimmigrant Workers,” September 19, 2025; State of California et al. v. Mullin, No. 1:25-cv-13829 (D. Mass. June 8, 2026) (vacating the proclamation); order denying stay pending appeal (1st Cir. July 24, 2026).
National Foundation for American Policy, “H-1B Petitions and Denial Rates in FY 2025,” NFAP Policy Brief, November 2025, 7.
National Foundation for American Policy, “H-1B Petitions and Denial Rates in FY 2025,” NFAP Policy Brief, November 2025, 5 and 12.
U.S. Department of State, Bureau of Consular Affairs, “Nonimmigrant Visa Issuances by Nationality and Visa Class,” monthly reports, October 2023–December 2025, travel.state.gov. Author’s calculation, calendar year 2025 against calendar year 2024. All student visa classes (F, M, J): 770,884 to 593,131, a 23.1% decline.
U.S. Department of State, Bureau of Consular Affairs, “Nonimmigrant Visa Issuances by Nationality and Visa Class,” monthly reports, October 2023–December 2025, travel.state.gov. Author’s calculation, calendar year 2025 against calendar year 2024. F-1 issuances: India 76,695 to 30,317; China (mainland) 80,550 to 56,147.
Proclamation 10043, “Suspension of Entry as Nonimmigrants of Certain Students and Researchers From the People’s Republic of China,” May 29, 2020; and “U.S. will ‘aggressively’ revoke Chinese students’ visas, Rubio says,” NBC News, May 28, 2025.
Proclamation 10973, “Restriction on Entry of Certain Nonimmigrant Workers,” September 19, 2025, sec. 1 and preamble.
U.S. Citizenship and Immigration Services, “H-1B Electronic Registration Process” (FY 2025: 470,342 eligible registrations); USCIS, “USCIS Reaches Fiscal Year 2027 H-1B Cap,” July 17, 2026 (211,600 registrations properly submitted, down 38.5% from FY 2026); U.S. Department of Homeland Security, “Weighted Selection Process for Registrants and Petitioners Seeking To File Cap-Subject H-1B Petitions,” final rule, 90 Fed. Reg. 60864 (December 29, 2025), effective February 27, 2026.
Ben A. Vagle and Stephen G. Brooks, Command of Commerce: America’s Enduring Economic Power Advantage over China (New York: Oxford University Press, 2025), ch. 2.
Vagle and Brooks, Command of Commerce, 49. Page from the publisher’s proof; may shift in the printed edition.
Sean Kenji Starrs, interview with the author, June 15, 2026.
The 15 roster firms already listed in 2004 fell from 36.3% to 17.8% of the world’s high-tech market capitalization over the same span.
Echo Wang, Kenrick Cai, Deepa Seetharaman and Krystal Hu, “Exclusive: OpenAI lays groundwork for juggernaut IPO at up to $1 trillion valuation,” Reuters, October 29, 2025; Reuters, “Anthropic’s IPO prospectus shows sweeping AI vision, surging costs,” September 28, 2026 (prospectus targets a valuation of more than $2 trillion; listing expected after the November 2026 midterms). Neither firm is counted in the market-capitalization figures in this section.
Bay Area technology firms captured approximately 52.2% of global high-technology-sector profit in FY2024: $611.1 billion earned by the 38 roster firms in the Forbes Global 2000, against a global high-technology total of $1,170.5 billion. Profit figures are FY2024, drawn from the Forbes Global 2000 (2025 edition). Methodology follows Vagle & Brooks (2025), rooted in Starrs.
Roughly half depends on the definition of high-tech in the Forbes world total dataset’s denominator. That guides what companies are incorporated. If legacy carmakers count, then the share falls to 47.6%. If 30 borderline firms added to the world total (including Alibaba, BYD, American Express, and others) are left out, then it would be about 57%.
Ben A. Vagle and Stephen G. Brooks, Command of Commerce: America’s Enduring Economic Power Advantage over China (New York: Oxford University Press, 2025), 45; Michael Beckley, “The Power of Nations: Measuring What Matters,” International Security 43, no. 2 (Fall 2018): 7–44.
Holding the list constant, these profit measures grow over time as these present companies grew up. Of the 38 on today’s roster, only 15 existed on Forbes Global 2000 list in 2004, the other 23 weren’t founded or public yet. Their absence from the Forbes list reflects timing, not competitive weakness.
Stephen Witt, The Thinking Machine: Jensen Huang, Nvidia, and the World’s Most Coveted Microchip (New York: Viking, 2025), 33.
Sean Kenji Starrs and Robert Hunter Wade, “No End in Sight for Global Capitalism: The Sinews of US Structural Power in the 21st Century,” The Japanese Political Economy (2026), 1–21, n. 1, https://doi.org/10.1080/2329194X.2026.2675224 (authors’ calculations from Yuki Okoshi and Masaharu Ban, “iPhone 15 Teardown Reveals 10% Costlier Parts than 2022 Flagship,” Nikkei Asia, October 21, 2023).
The “IT Stack” adopts Baums and Butts’ framework. NVIDIA, though seeking to play across the IT stack, relies on revenue from selling the chips it designs. Microsoft and Amazon are categorized as cloud providers as it is their primary source of operating income in their 10-Ks. Palo Alto Networks and Fortinet provide firewall services and are folded into Cloud, even though their business diverges in Telecom and AI/Platforms respectively.
Intel lost $19B in FY2024. Without Intel, the cluster’s share would be 53.0%, up from 52.2%.
Sean Kenji Starrs, interview with the author, June 15, 2026.
Taking out a single firm shows how quickly the headline moves: without NVIDIA, the cluster’s share of world high-tech profit falls from 52.2% to 49.0%; without Alphabet, to 47.2%. Both firms are removed from the cluster and the world total alike. Forbes Global 2000, 2025 edition (FY2024 net profit).
Harald Puhr, Jakob Müllner and Claudia Trentini, “An Innovative Measure for Digital Firms’ Internationalization,” Transnational Corporations 30, no. 3 (2023): 132–133.
Companies are required by law to disclose the split between foreign and domestic income before taxes. FPTP measures pretax income. That’s different from the net-income figure representing profit found in the Forbes Global 2000 share analysis.
Source: SEC EDGAR XBRL, us-gaap IncomeLossFromContinuingOperationsBeforeIncomeTaxes, Domestic and Foreign, latest 10-K with fiscal year ending by March 31, 2025; author’s calculation.
Lam Research Corporation, Form 10-K for the fiscal year ended June 29, 2025, 17 (in 2025 Proxy Statement & Annual Report).
Meta Platforms, Inc., Form 10-K for the fiscal year ended December 31, 2024, Income Taxes note: domestic $66,342 million, foreign $4,321 million; “Foreign-derived intangible income deduction (4.9)%” (SEC accession 0001326801-25-000017).
Several companies fell out of range due to reporting negative income: Intel −20.0%, Broadcom 148.9%, AMD −17.2%, DoorDash −492.9%, Workday −3.4%, Lyft −142.1%, Western Digital (losses in both geographies). This is a limitation in the FPTP transnationality metric.
Companies in the list can report “Foreign-Derived Intangible Income” (FDII) that allows them to deduct taxable income of sales abroad from the IP, such as patents and trademarks, developed in US. To capture that benefit, they can set up subsidiaries overseas operating on thin margins, license their own product to it, and then report the accounting profit from those overseas customers earned by that subsidiary on U.S. parent books as licensing income. For more on FDII’s mechanics, see Tax Foundation, “Foreign-Derived Intangible Income (FDII),” TaxEDU Glossary, https://taxfoundation.org/taxedu/glossary/foreign-derived-intangible-income-fdii/; on its controversy in the WTO, see Jonathan S. Brenner and Josiah P. Child, “The Nitty-Gritty of FDII,” Tax Notes, September 17, 2018, https://www.taxnotes.com/special-reports/tax-cuts-and-jobs-act/nitty-gritty-fdii/2018/09/14/28bv6.
Tax Foundation, “Foreign-Derived Intangible Income (FDII),” TaxEDU Glossary, https://taxfoundation.org/taxedu/glossary/foreign-derived-intangible-income-fdii/.
Puhr, Müllner and Trentini, “An Innovative Measure for Digital Firms’ Internationalization,” 132, citing Sinéad Monaghan, Esther Tippmann and Nicole Coviello, “Born Digitals: Thoughts on Their Internationalization and a Research Agenda,” Journal of International Business Studies 51, no. 1 (2020): 11–22, and Arto Ojala and Pasi Tyrväinen, “Business Models and Market Entry Mode Choice of Small Software Firms,” Journal of International Entrepreneurship 4, no. 2–3 (2006): 69–81.
Puhr, Müllner and Trentini, 134–135.
StatCounter, "Search Engine Market Share Worldwide," https://gs.statcounter.com/search-engine-market-share (accessed 30 July 2026).
Puhr, Müllner and Trentini, 139.
Puhr, Müllner and Trentini, 139–143.
Ibid., 140.
Meta DOI: author’s calculation from Google Trends (globaltrends R package; basket of “Instagram”, “Facebook” and “WhatsApp” aggregated before computing DOI; 71 countries; January 2020–June 2026), period mean 0.707. Daily active people: Meta Platforms, Inc., “Meta Reports Second Quarter 2026 Results,” press release, July 29, 2026 (“DAP was 3.60 billion on average for June 2026”). The 6.1% FPTP is from the FY2024 Form 10-K cited above; the company does not disclose product-level profit. This note was written by Claude Fable 5.1.
Claudia Trentini, Joao de Camargo Mainente and Amelia Santos-Paulino, “UNCTAD Insights: The Evolution of Digital MNEs: An Empirical Note,” Transnational Corporations 29, no. 1 (2022): 163–187.
Puhr, Müllner and Trentini, “An Innovative Measure for Digital Firms’ Internationalization,” 154 n. 11.
Baskets, gated for homonyms before pulling: OpenAI (OpenAI, ChatGPT); Amazon (Amazon, Amazon Prime, Prime Video); Adobe (Photoshop, Acrobat, Illustrator); Alphabet (Google Search, Google Chrome, Google Play); Uber (Uber, Uber Eats); Meta (Instagram, Facebook, WhatsApp); Autodesk (Autodesk, AutoCAD, Revit); PayPal (PayPal, Venmo); Anthropic (Anthropic, Claude AI); Electronic Arts (EA Sports, EA FC, The Sims); xAI (xAI, Grok AI); Intuit (TurboTax, QuickBooks, Credit Karma); Airbnb, Netflix and DoorDash by name. Stripe was excluded because its terms returned signal in only 43 of the 71 countries; DoorDash returned signal in 69. Each period’s DOI is the median of its 39 monthly values rather than the mean, because October 2025 and February 2024 show one-month collapses across unrelated firms (Adobe, Alphabet, Autodesk, PayPal) that are artefacts of the source, not demand; on means, those two months alone would turn three flat firms into small declines. Venmo and Credit Karma are sold only in the United States, so they pull PayPal and Intuit toward home by construction. This note was written by Claude Fable 5.1.
Matt Sheehan, The Transpacific Experiment: How China and California Collaborate and Compete for Our Future (Berkeley: Counterpoint, 2019), 194; fDi Markets (Financial Times), “fDi Markets Data Dictionary – Industry Definitions Tables,” Business Activity definitions; fDi Markets Client Success, email to author, June 2026 (each project is assigned “a business function based on the primary activity at the site”).
fDi Markets (Financial Times), “All data from California” source set, retrieved August 5, 2026. 2,018 announced greenfield projects, January 2010–May 2026, by 44 out of 47 possible roster firms, excluding the Washington-headquartered companies Amazon and Microsoft due to data availability (fDi Markets attributes every project to a firm’s headquarters state, so their projects sit outside the California source set); Anysphere had no recorded project. Five exports of at most 500 rows each, sorted by date and overlapping at the boundaries; 2,091 rows before removing duplicates.
fDi Markets team provided the Data Dictionary that provides the definitions of every activity mix. Those visible in this chart are as follows: Sales, Marketing & Support is defined as follows: "The Sales, Marketing & Support activity is assigned to projects where the physical presence is engaged in the development of sales, marketing a company's product and providing support to clients. These projects are typically offices." Headquarters is defined as follows: "The Headquarters activity is assigned to projects where the physical presence is a regional, national or divisional head office for a company." This chart labels it Regional Headquarters, based on a verified spot-check of the underlying rows. Maintenance & Servicing is defined as follows: "The Maintenance and Servicing activity is assigned to projects where the physical presence is engaged in the repair and upkeep of various vehicles, machines and electronics." Research & Development is defined as follows: "The Research & Development activity is assigned to projects where the physical presence is engaged in the research, development and testing of products and technologies. This covers high-level academic research and development in the Life Sciences cluster as well as software development. Sites used for testing goods and diagnostic labs will be assigned this business function." Manufacturing is defined as follows: "The Manufacturing activity is assigned to projects where the physical presence is engaged in the large-scale industrial production of goods including food, vehicles, electronics and pharmaceuticals among others." Business Services is defined as follows: "The Business Services activity is assigned to projects where the physical presence is a means of delivering a service. These projects are typically offices for projects in the Financial Services and Business Services sector." ICT & Internet Infrastructure is defined as follows: "The ICT & Internet Infrastructure activity is assigned to projects where the physical presence is providing the physical infrastructure for the deployment of wired and wireless connectivity services. Projects with this activity are typically broadband infrastructure, data centres, data recovery and wireless communications projects. As more companies launch internal ICT infrastructure, this means this activity can be seen across multiple sectors." The "(Other, 6)" segments on the Revenue and Resource bars are rollups rather than single named activities: on Revenue this combines Education & Training and Technical Support Centre, and on Resource this combines Shared Services Centre and Logistics, Distribution & Transportation.
Foreign shareholding in internet data centre (IDC) services in China has been capped at 50%; the cap was lifted only in four pilot zones by MIIT Document No. 107 of April 10, 2024. See Geopolitechs, “China Removes Foreign Ownership Restrictions on More Value-Added Telecom Services,” April 2024; “AWS Sells Assets in China to Comply with the Law, Will Continue Offering Cloud Services,” Data Center Dynamics, November 14, 2017 (AWS sold its China data-centre assets to Sinnet to comply with “laws that prevent non-Chinese companies from owning certain critical infrastructure assets, including those involved with the delivery of cloud services”); “Apple Hands Chinese iCloud to Guizhou-Cloud Big Data Industry,” The Register, January 11, 2018. The ten China infrastructure projects in the dataset (Equinix, HP, Oracle, Intel, Apple) date from 2011 to 2018; fDi Markets classes data centres under “ICT & Internet Infrastructure.”