


Happy Thursday friends,
Today’s happy little chapter of “Bay Area Abroad: Innovation through Fragmentation” happens to cover a peaceful period of little fragmentation: in the 1990s and into the new millennium, the United States sat atop the global world order alone. Washington had no rivals to police technology flows and the Bay Area benefited. Manufacturing and talent globalized.
Table of Contents: Introduction | How the Bay Area Makes New Tech | The Cold War | Japan | Globalization of the 1990s | China into Today | Today’s Fragmenting Flashpoints | Assessing The Engine & The Exposure | Conclusion
Help is always appreciated—anyone here remember the 90s? What’s missing in this story?

When the Berlin Wall fell in 1989 and the Soviet Union dissolved in 1991, the United States stood alone atop the world order. Bay Area innovations could flow worldwide with unprecedented ease. New technology, immigrant talent, and investment faced little resistance in crossing borders. Manufacturing and talent spliced into regions where advantages lie—it all added up to globalization in the absence of fragmentation.
Washington Gets Out of the Way
When this Administration came into office, certain basic personal computers, such as IBM PCs and Apple McIntoshes [sic], were still being controlled. Last September, we took the first step to liberalize licensing requirements for over $30 billion worth of computer exports. — Office of the Press Secretary, President Clinton White House, March 30, 19941
Fragmenting technology flows along Cold War lines made little sense now that it was over. Washington got out of the way by easing restrictions on exports. This included the innovations at the time: personal computers, consumer electronics, and the commercial internet all rapidly globalized. Access to the frontier was less expensive. The customers of earlier waves were mostly governments and corporations; now ordinary people were exposed to what the frontier felt like.
The internet had defense origins that went global to civilian markets. In Menlo Park, the Stanford Research Institute (SRI), funded by the Pentagon, hosted the second computer on ARPANET, the network that would open up and become the internet.2
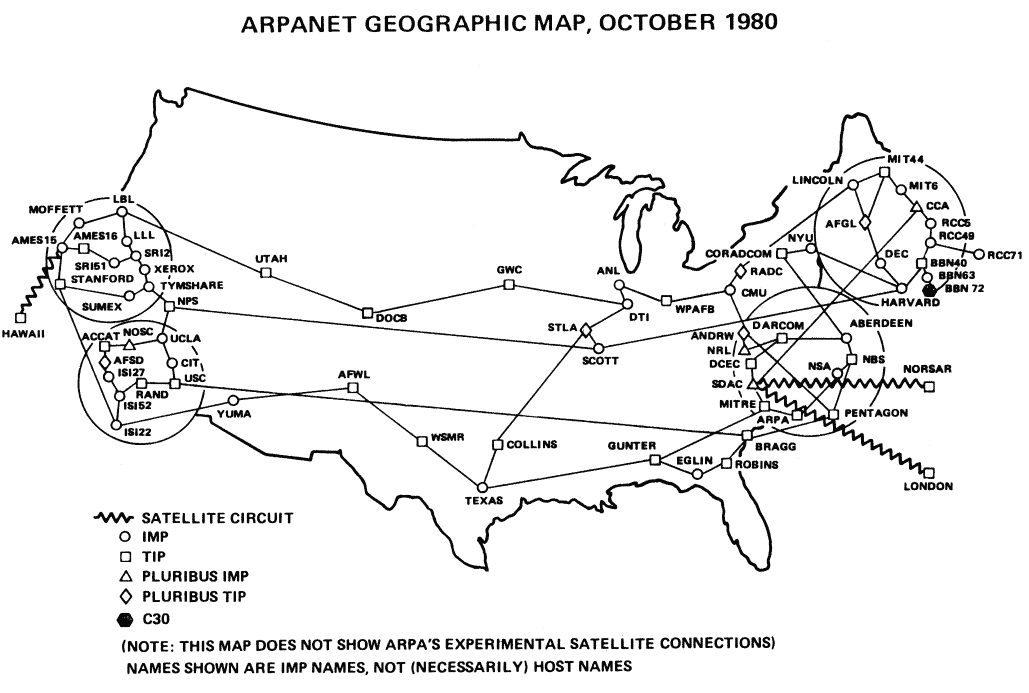
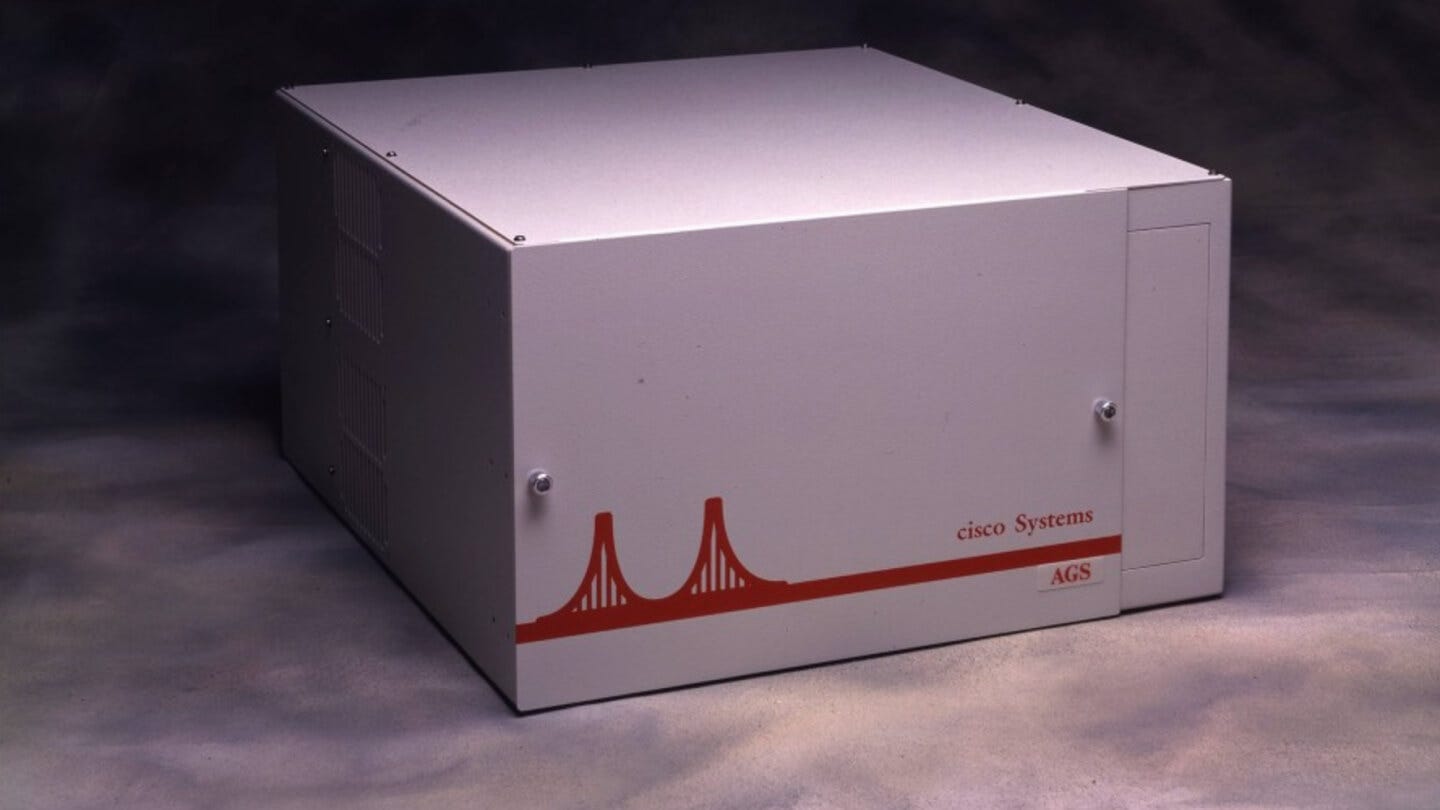
By the 1990s, ARPANET was discontinued and a network of open nodes emerged that would become the early internet. Private companies like AT&T and Cisco Systems led the buildout.3 Digital fiber-optic cabling and the networking equipment allowed communication to flow at the speed of light, eased global investing and lowered the barriers of trade friction.
The White House eased the restrictions on these civilian technologies, many of which had parts previously deemed strategically sensitive. On March 30, 1994, the Press Secretary announced the end of CoCom: “the end of the Cold War and the disintegration of the Soviet Union and the Warsaw Pact led us and our allies to the view that COCOM’s strategic rationale was no longer tenable.”4
Facing fewer restrictions, high-technology exports from the United States rose. U.S. exports of advanced technology products rose from $94.7 billion in 1990 to $227.4 billion in 2000, a 140 percent increase.5
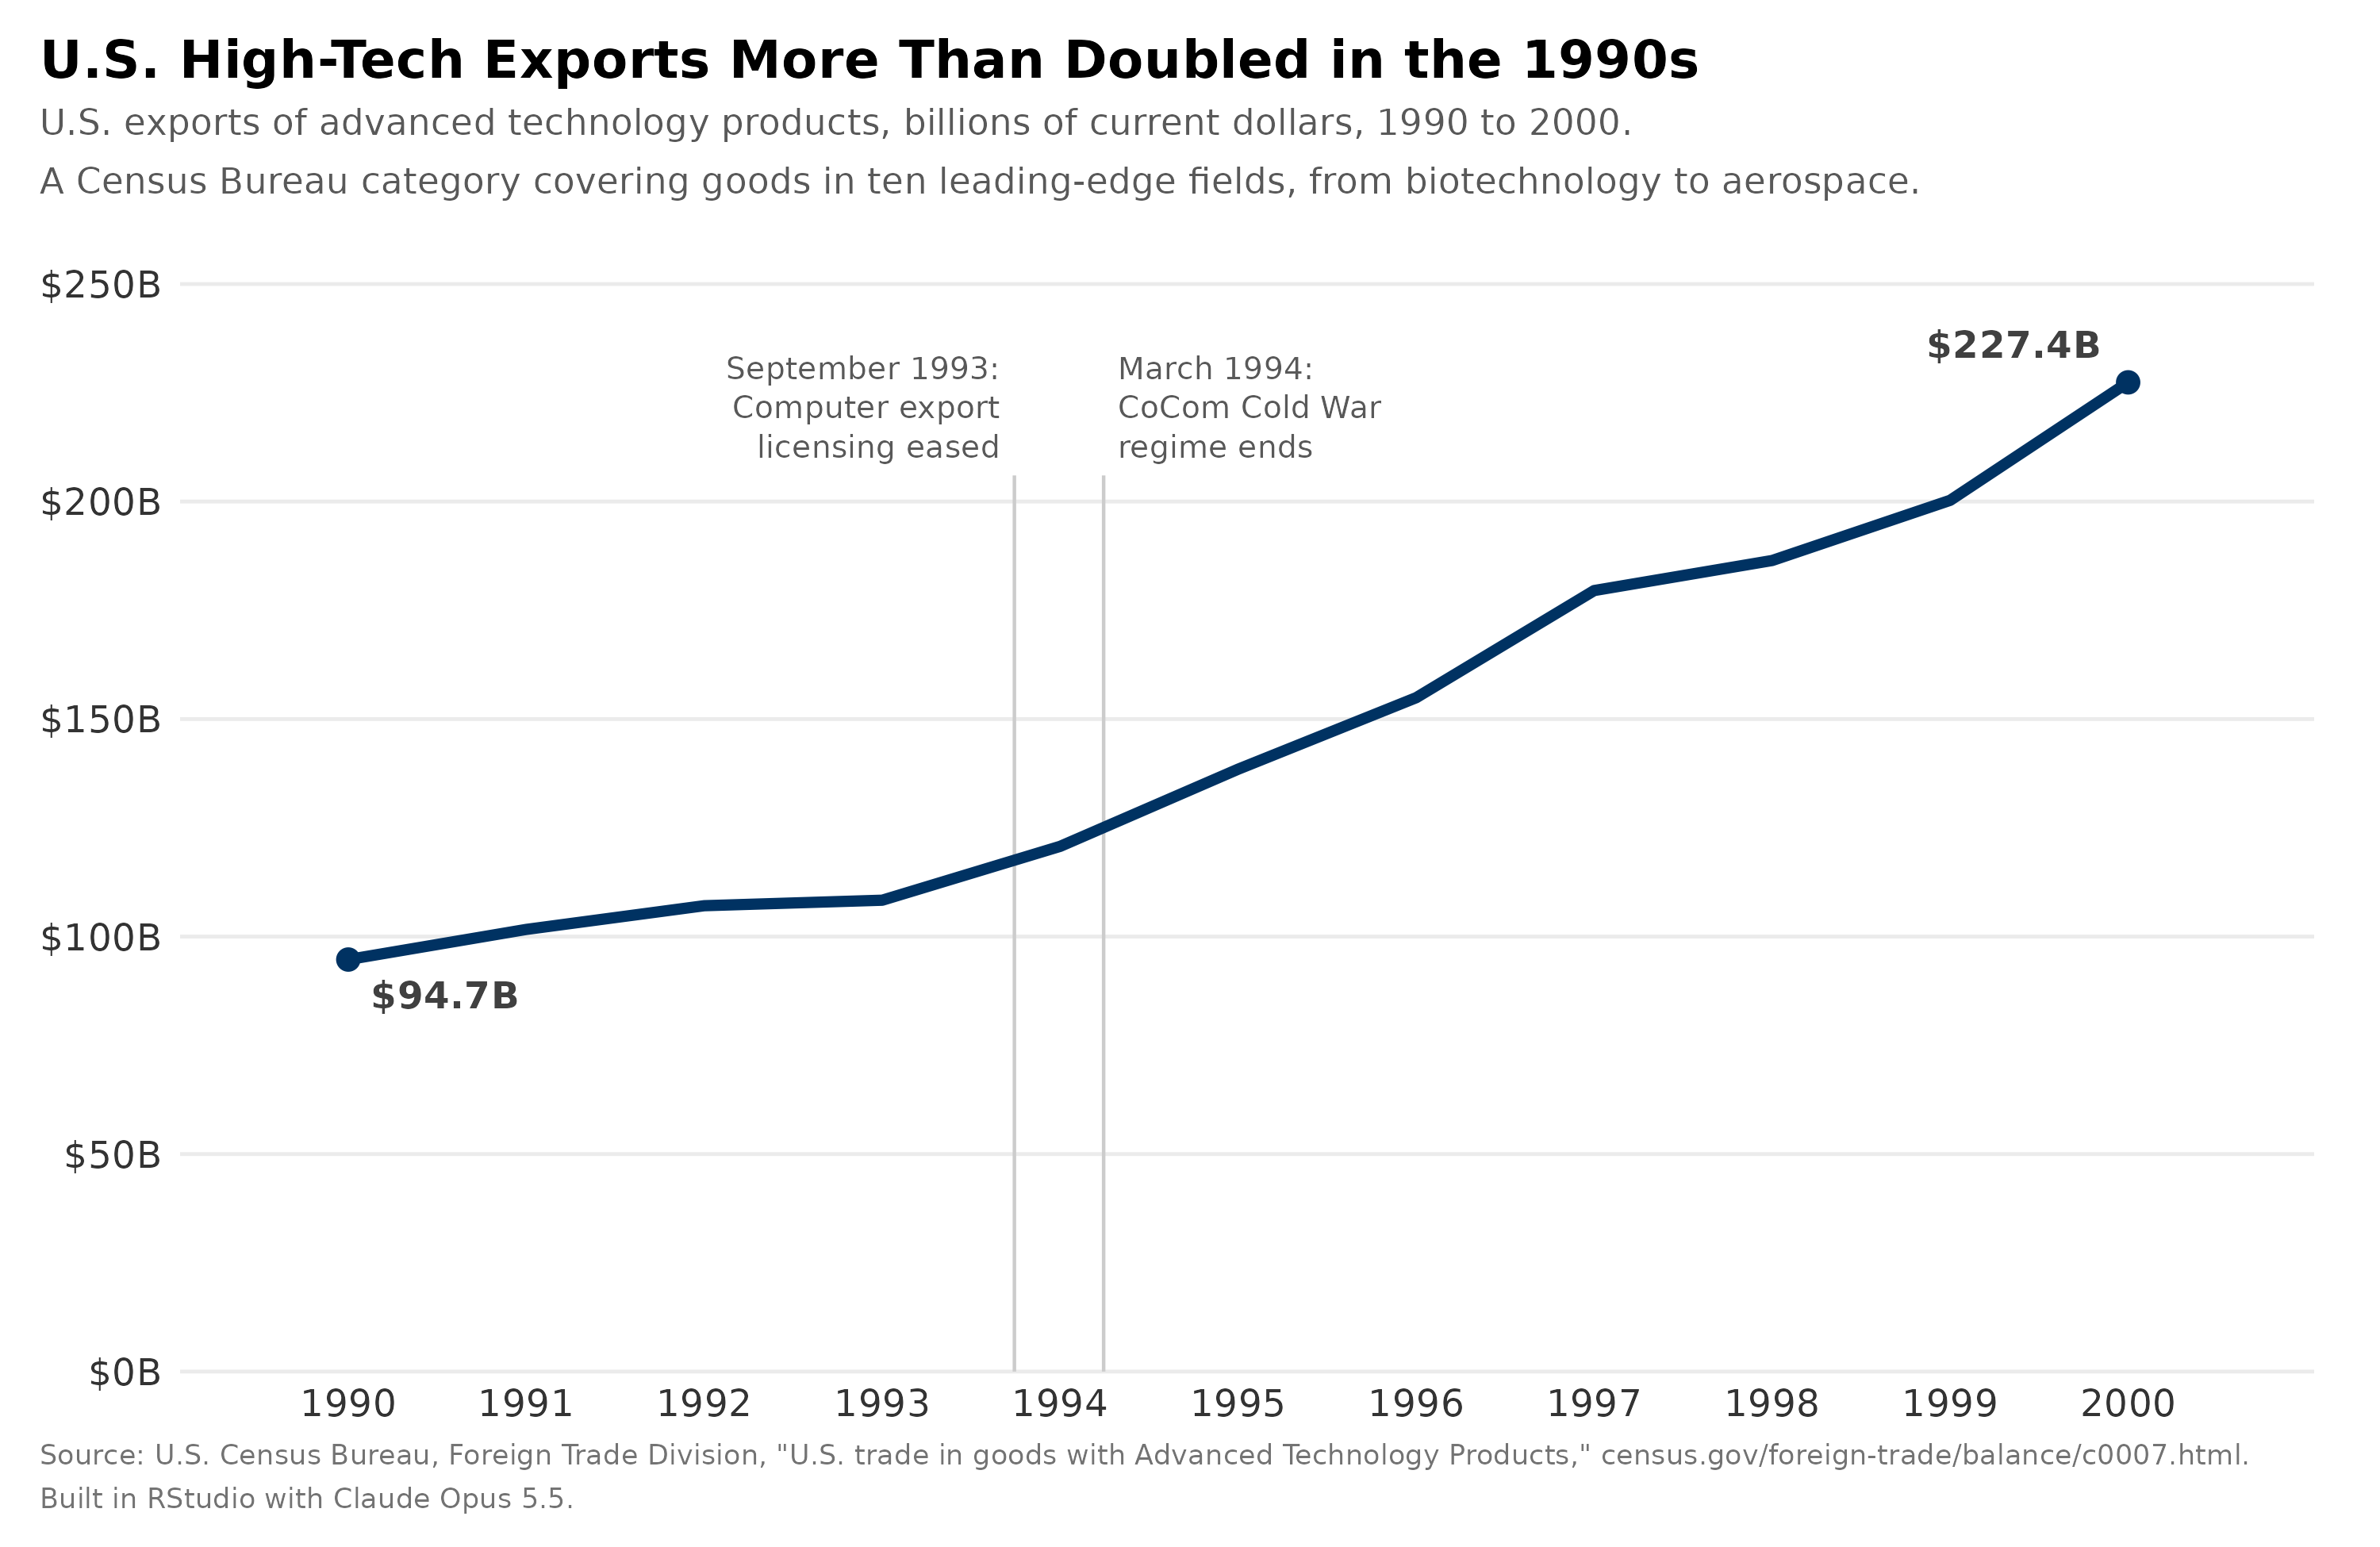
Commerce Secretary Ron Brown testified to Congress in January 1995 on the Clinton administration’s liberalizing policies to promote innovation: “freeing $32 billion in exports by reducing controls on U.S. computer and telecommunications products.”6 Exports rose as high-technology manufacturing and talent spread across borders into new markets where regional advantages lie.7
Manufacturing Goes Global
Over the 1990s and 2000s, the manufacturing chains that exist today began to take shape. The triangle of economic relationships linking Taiwan, the People’s Republic of China (PRC), and Bay Area firms developed, giving rise to the value chains that ultimately built consumer electronics.8 Along coastal China, decades of small-scale investment, primarily from Hong Kong and Taiwan, had built up a manufacturing base for labor-intensive goods. That base let the region take on low-cost consumer electronics like laptops.
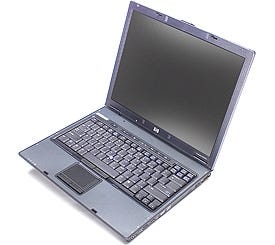
Hewlett-Packard’s laptops demonstrate the division of work in this triangle. Proprietary specifications for the notebooks arose out of the Palo Alto headquarters, but HP relied on Taiwanese manufacturers, like Quanta and Compal, to flesh out the mechanical, electrical, and software designs.9 Intel supplied the processors and chipsets in this era, mostly made in its own U.S. factories.10 China took over with final assembly, mostly by Taiwanese contract manufacturers.11
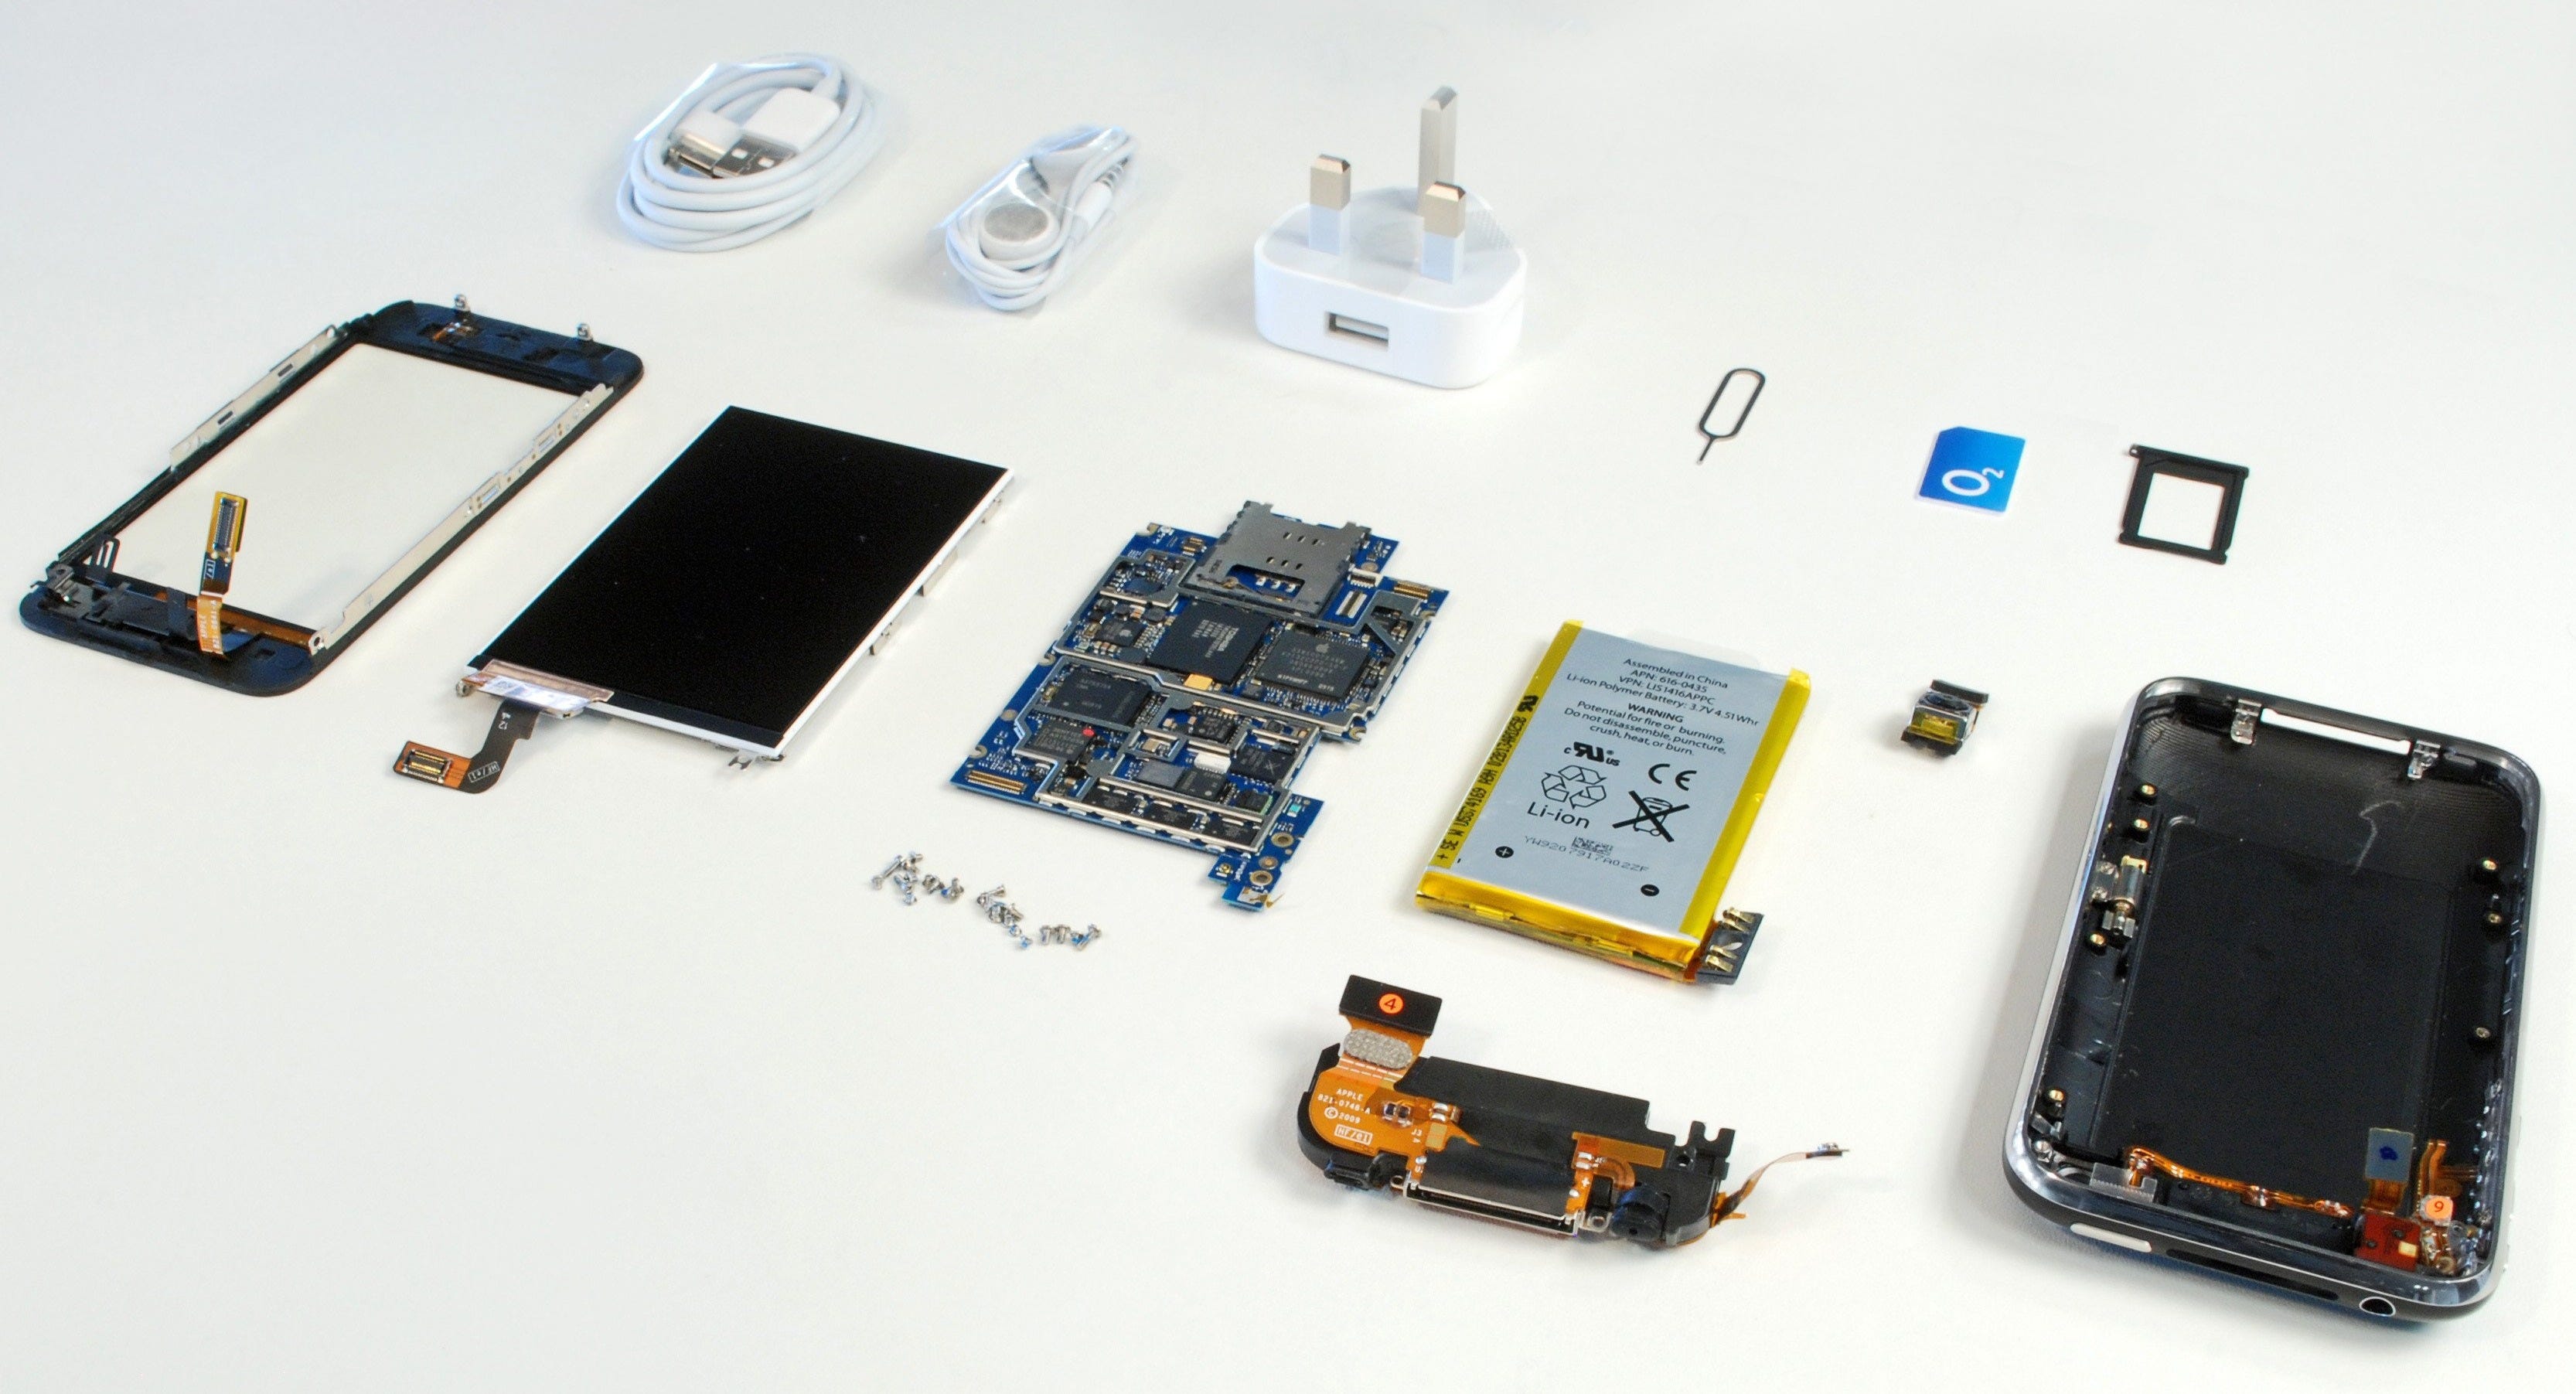
Into the latter half of the 2000s, supply chains would only grow in complexity. Apple began taking full advantage of supply chains going worldwide. In earlier iPhones, “Designed by Apple in California, Assembled in China” was etched in the back, but manufacturing involved many more countries even then.12 A 2009 iPhone 3G teardown revealed nine companies spread across China, South Korea, Japan, Germany, and the US, with all components sent to a Foxconn facility in Shenzhen for final assembly.13 Looking today, the trend has continued: a 2025 Financial Times teardown found iPhones have grown even more complex, drawing on 187 suppliers across 28 countries.14
Immigrants Arrive in the Bay Area
Supply chains were only part of the story; firms brought more overseas talent into the Bay Area than ever before. As companies globalized, an insatiable demand for the best minds grew that the American pipeline alone could not meet.
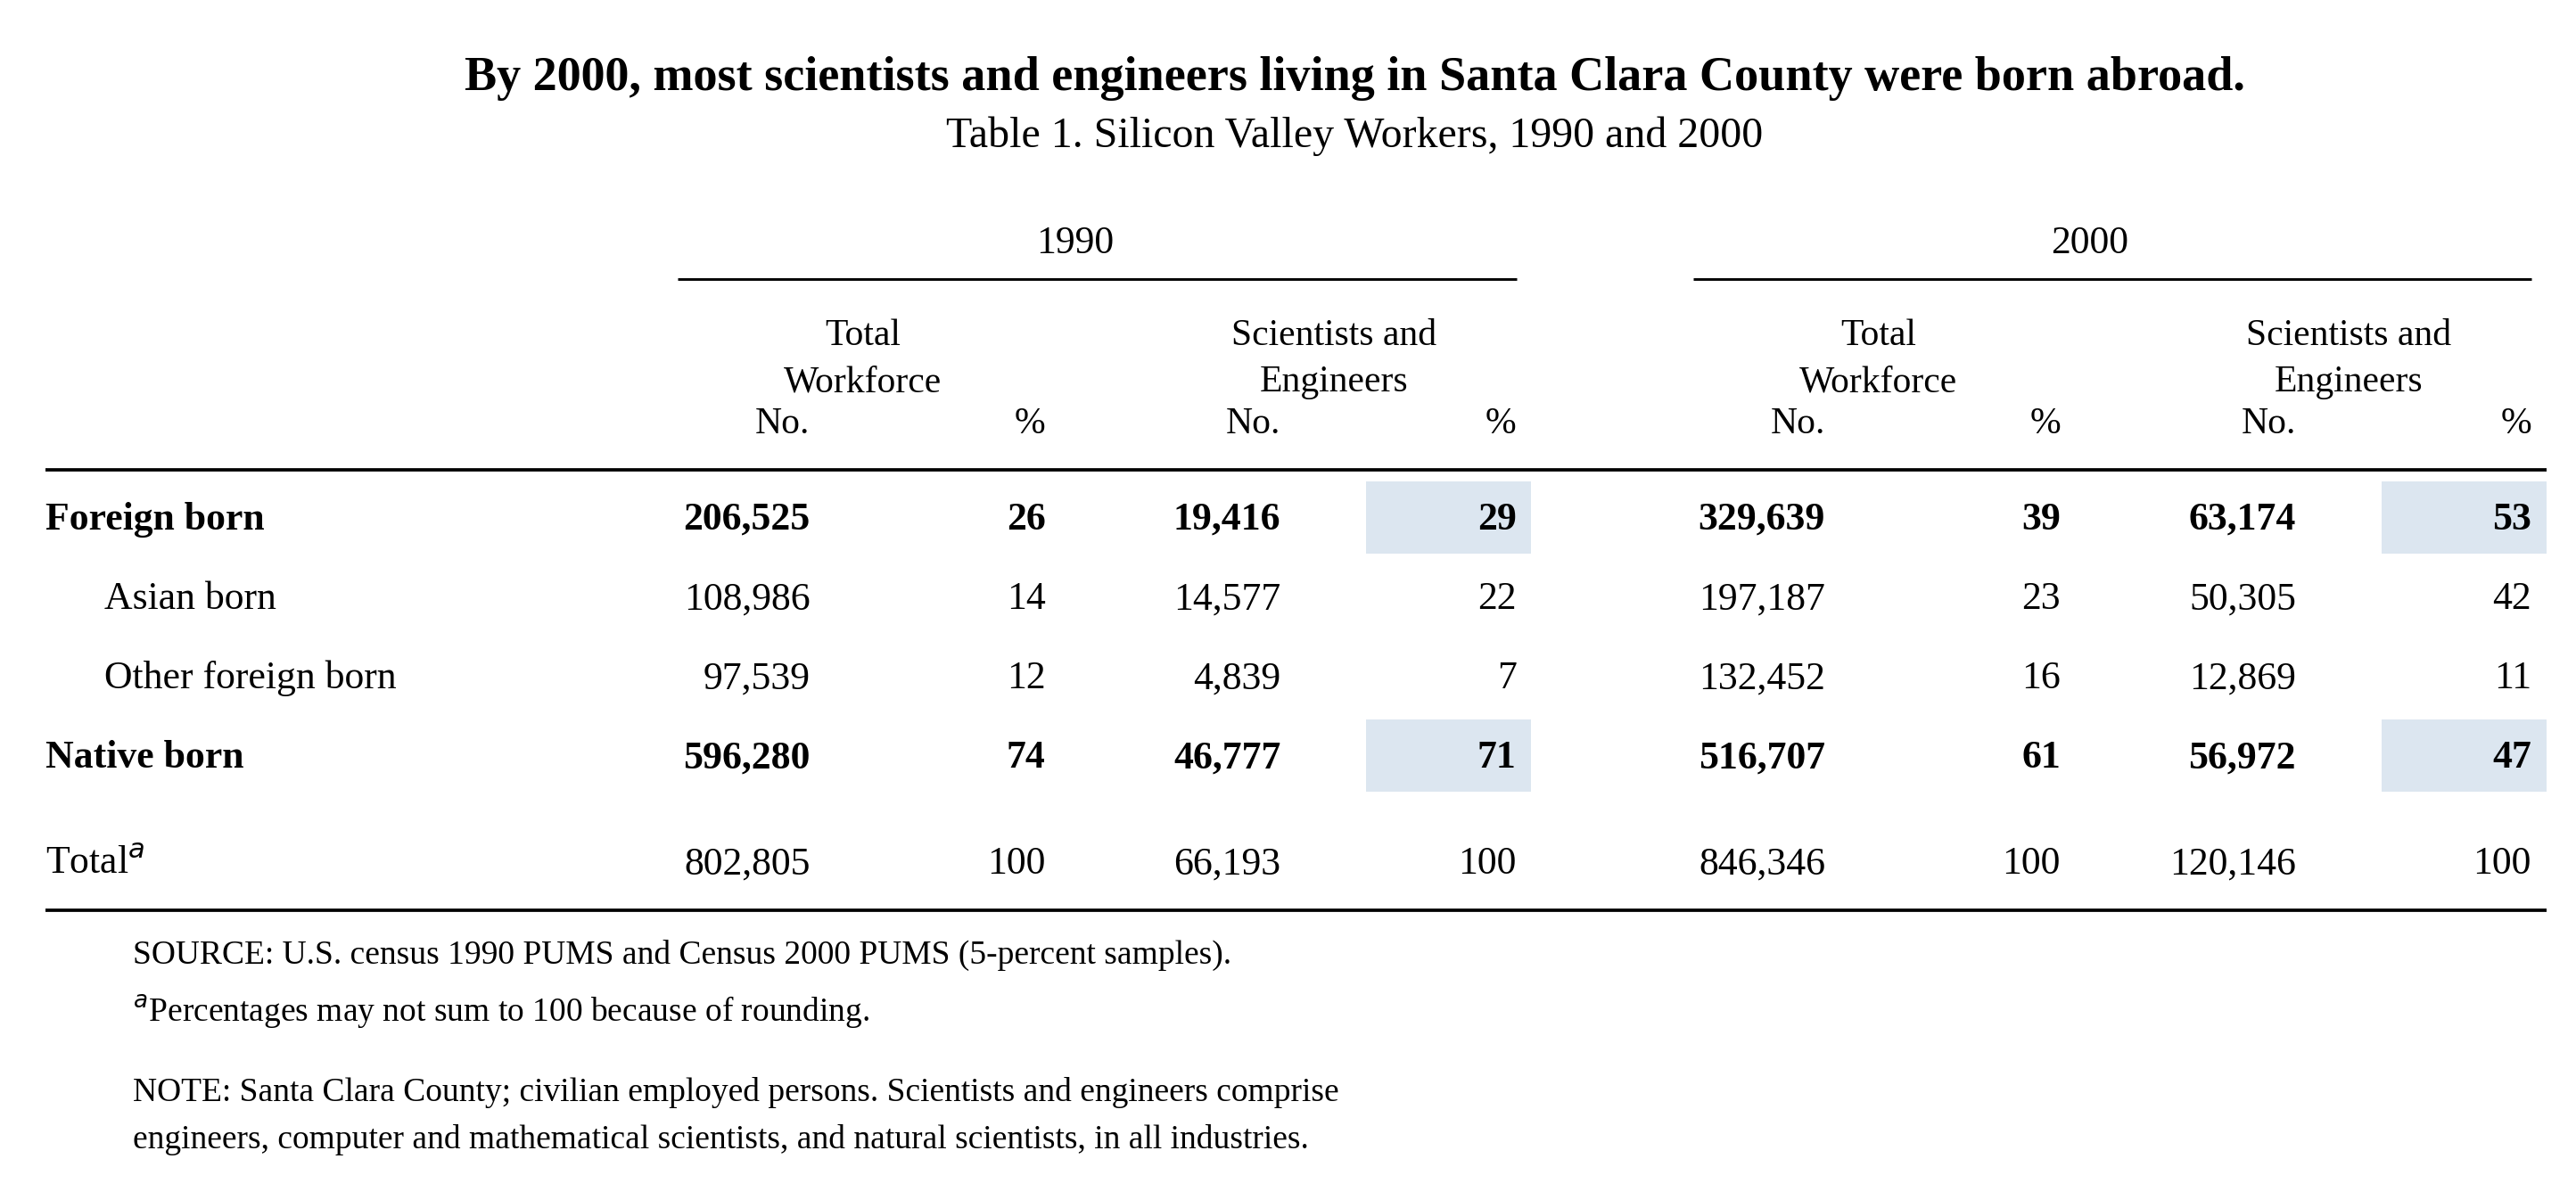
Educated Asian scientists and engineers moved to the Bay Area. By 2000, more foreign-born scientists and engineers lived in Santa Clara County than native-born. In 1990, Dr. AnnaLee Saxenian found that one-third of scientists and engineers working in Santa Clara were born overseas, almost two-thirds of whom were Asian.15 I extended the analysis below with the same census data, finding the foreign-born share of the region’s scientists and engineers rose significantly, from 29 percent in 1990 to 53 percent in 2000, overtaking native-born workers.16
Not only were more immigrants moving to work in tech companies, but they also began to run more of them. As the Brookings Institution reports, “By the end of the 1990s, Chinese and Indian engineers were running 29 percent of Silicon Valley’s technology businesses. By 2000, these companies collectively accounted for more than $19.5 billion in sales and 72,839 jobs.”17
Duke and UC Berkeley researchers found the pattern held for new companies too: over half (52.4%) of Silicon Valley startups founded between 1995 and 2005 had at least one immigrant as a key founder, well above the California average of 38.8%.1819 The trend largely holds today: one 2026 study estimates that “70% of the Bay Area’s unicorn companies have an immigrant founder.”20
Clusters Abroad Benefit
The increase in high-skilled technology talent that flowed into the Bay Area led to a “brain circulation” that increasingly benefited both sides, rather than draining one direction only. For example, engineering talent grew as some immigrants chose to stay in or return to China, India, and Taiwan.21
Taiwanese immigrant Miin Wu earned a PhD in electrical engineering from Stanford University in 1976, then worked for more than a decade across Bay Area semiconductor companies. Eventually the Taiwanese economy improved, and he started one of Taiwan’s first semiconductor companies in 1989, Macronix Co. Going public on the Taiwan stock exchange in 1995, the firm regularly recruited Bay Area managers and invested in startups by the early 2000s.22
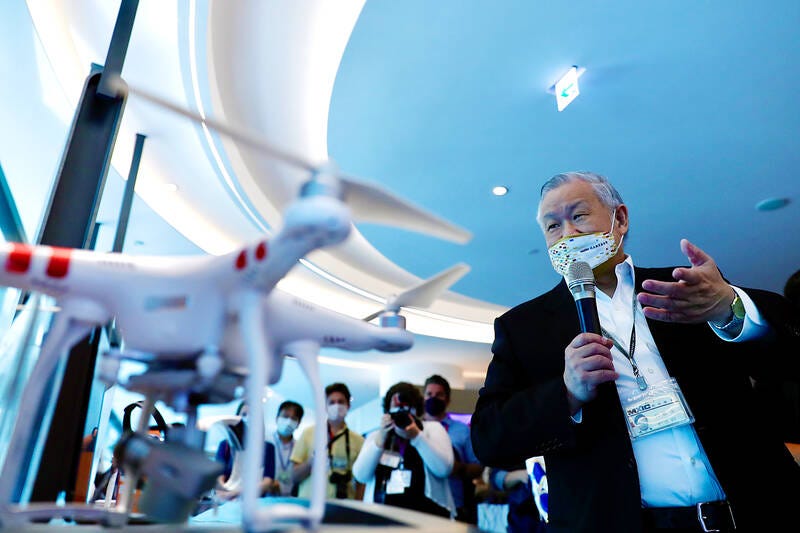
These mutual flows planted new seeds of shared trust, ideas, people, and technology—unique clusters of innovation began emerging worldwide.23 To this day, local producers remain in their home countries but stay connected to immigrant entrepreneurs in the Bay Area. Both sides own companies that span the value chain for products used today.
Manufacturing and talent moved with newfound fluidity, but fragmentation would not be gone forever… China would soon emerge as a new competitor.
Thank you for being here,
Max
The White House, Office of the Press Secretary, “Export Control Reform,” March 30, 1994, https://clintonwhitehouse6.archives.gov/1994/03/1994-03-30-president-announces-reform-of-export-control-system.html.
SRI International, “75 Years of Innovation: ARPANET,” July 23, 2020, https://www.sri.com/75-years-of-innovation/75-years-of-innovation-arpanet/.
Defense Advanced Research Projects Agency, “ARPANET,” https://www.darpa.mil/news/features/arpanet; U.S. National Science Foundation, “Birth of the Commercial Internet,” May 10, 2024, https://www.nsf.gov/impacts/internet; Cisco Systems, “Cisco Scales the Internet,” press release, September 16, 1996, https://newsroom.cisco.com/c/r/newsroom/en/us/a/y1996/m09/cisco-scales-the-internet.html.
The White House, “Export Control Reform,” March 30, 1994.
Advanced technology products is the U.S. Census Bureau’s category for goods carrying leading-edge technology, spanning ten fields: biotechnology, life science, opto-electronics, information and communications, electronics, flexible manufacturing, advanced materials, aerospace, weapons and nuclear technology. The chart shows the combined annual export value of all ten, in current dollars, not adjusted for inflation. The series is national; the Census Bureau does not publish it by state or metropolitan area. Source: U.S. Census Bureau, Foreign Trade Division, “U.S. trade in goods with Advanced Technology Products,” https://www.census.gov/foreign-trade/balance/c0007.html, retrieved 3 September 2026.
Ron Brown, Secretary of Commerce, testimony before the Committee on Science, U.S. House of Representatives, January 6, 1995, https://clintonwhitehouse4.archives.gov/WH/EOP/OSTP/other/tsdoc1.html.
Henry Farrell and Abraham Newman, Underground Empire: How America Weaponized the World Economy (Henry Holt, 2023), chap. 1.
AnnaLee Saxenian, The New Argonauts: Regional Advantage in a Global Economy (Harvard University Press, 2006), 198–99.
Jason Dedrick, Kenneth L. Kraemer, and Greg Linden, “Who Profits from Innovation in Global Value Chains? A Study of the iPod and Notebook PCs,” Industry Studies Working Paper 2008-15 (University of Pittsburgh, 2008), 7, 18, http://isapapers.pitt.edu/97/1/2008%2D15_Dedrick.pdf.
Intel Corporation, Form 10-K for the fiscal year ended December 25, 2004, “Manufacturing and Assembly and Test,” https://www.sec.gov/Archives/edgar/data/50863/000119312505033162/d10k.htm.
Dedrick, Kraemer, and Linden, “Who Profits,” 3.
Chris Miller and Vishnu Venugopalan, “Apple’s Supply Chain: Economic and Geopolitical Implications,” American Enterprise Institute, June 3, 2025, https://www.aei.org/research-products/report/apples-supply-chain-economic-and-geopolitical-implications/.
Yuqing Xing and Neal Detert, “How the iPhone Widens the United States Trade Deficit with the People’s Republic of China,” ADBI Working Paper 257 (Asian Development Bank Institute, December 2010, rev. May 2011), 3, 5, https://www.adb.org/sites/default/files/publication/156112/adbi-wp257.pdf. China’s share contributed “only US$6.5 to each iPhone, about 3.6% of the total manufacturing cost.” Of the roughly US$2.0 billion worth of iPhones exported from the PRC, the vast majority (96.4%) actually represented transfers from other countries’ components: Germany (US$326 million), Japan (US$670 million), Korea (US$259 million), the US (US$108 million), and other countries (US$542 million).
“Why Trump Can’t Build iPhones in the US,” Financial Times, April 28, 2025, https://ig.ft.com/us-iphone/.
AnnaLee Saxenian, “Silicon Valley’s New Immigrant Entrepreneurs,” Working Paper 15 (Center for Comparative Immigration Studies, UC San Diego, May 2000), 4, https://ccis.ucsd.edu/_files/wp15.pdf.
Author’s calculation from 1990 and 2000 Census PUMS (5-percent samples), Santa Clara County; method replicates Saxenian, The New Argonauts, Table 2.1.
AnnaLee Saxenian, “Brain Circulation: How High-Skill Immigration Makes Everyone Better Off,” The Brookings Review 20, no. 1 (Winter 2002), https://www.brookings.edu/articles/brain-circulation-how-high-skill-immigration-makes-everyone-better-off/.
Vivek Wadhwa, AnnaLee Saxenian, Ben Rissing, and Gary Gereffi, “America’s New Immigrant Entrepreneurs” (Duke University and UC Berkeley, January 4, 2007), 31, https://people.ischool.berkeley.edu/~anno/Papers/Americas_new_immigrant_entrepreneurs_I.pdf.
The same authors have released a follow-on paper, finding that from 2006 to 2012, the share dropped from 52.4% (1995 – 2005) to 43.9% (2006 – 2012). Vivek Wadhwa, AnnaLee Saxenian, and F. Daniel Siciliano, “America’s New Immigrant Entrepreneurs: Then and Now” (Ewing Marion Kauffman Foundation, October 2012), 26–27, https://www.kauffman.org/wp-content/uploads/2019/12/Then_and_now_americas_new_immigrant_entrepreneurs.pdf.
Stuart Anderson, “Immigrants and U.S. Billion-Dollar Companies,” NFAP Policy Brief (National Foundation for American Policy, June 2026), 6, https://nfap.com/wp-content/uploads/2026/06/IMMIGRANTS-AND-US-BILLION-DOLLAR-COMPANIES.NFAP-Policy-Brief.2026-5.pdf.
Saxenian, “Brain Circulation.”
Saxenian, “Brain Circulation.”
Mehran Gul, The New Geography of Innovation: The Global Contest for Breakthrough Technologies (Avid Reader Press/Simon & Schuster, 2026).